Page 35 - NobleCon21
P. 35

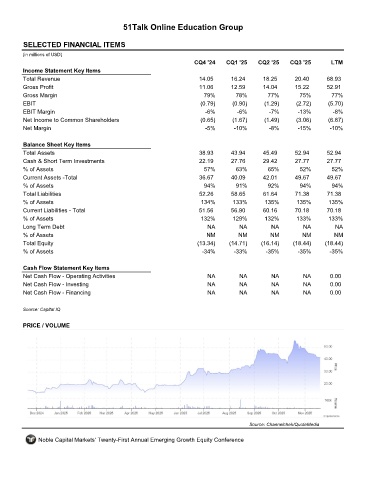
51Talk Online Education Group


         SELECTED FINANCIAL ITEMS                                 COE
         (in millions of USD)
                                                                     CQ4 '24    CQ1 '25    CQ2 '25    CQ3 '25       LTM
         Income Statement Key Items
         Total Revenue                                                14.05      16.24       18.25      20.40      68.93
         Gross Profit                                                 11.06      12.59       14.04      15.22      52.91
         Gross Margin                                                   79%        78%        77%        75%        77%
         EBIT                                                          (0.79)     (0.90)     (1.29)     (2.72)     (5.70)
         EBIT Margin                                                    -6%         -6%        -7%       -13%        -8%
         Net Income to Common Shareholders                             (0.65)     (1.67)     (1.49)     (3.06)     (6.87)
         Net Margin                                                     -5%       -10%         -8%       -15%       -10%

         Balance Sheet Key Items
         Total Assets                                                 38.93      43.94       45.49      52.94      52.94
         Cash & Short Term Investments                                22.19      27.76       29.42      27.77      27.77
         % of Assets                                                    57%        63%        65%        52%         52%
         Current Assets -Total                                        36.67       40.09      42.01      49.67      49.67
         % of Assets                                                    94%        91%        92%        94%         94%
         Total Liabilities                                            52.26       58.65      61.64      71.38      71.38
         % of Assets                                                   134%       133%       135%       135%       135%
         Current Liabilities - Total                                  51.56      56.90       60.16      70.18      70.18
         % of Assets                                                   132%       129%       132%       133%       133%
         Long Term Debt                                                  NA         NA         NA          NA         NA
         % of Assets                                                     NM         NM         NM         NM         NM
         Total Equity                                                 (13.34)    (14.71)    (16.14)    (18.44)    (18.44)
         % of Assets                                                   -34%       -33%        -35%       -35%       -35%

         Cash Flow Statement Key Items
         Net Cash Flow - Operating Activities                            NA         NA         NA          NA       0.00
         Net Cash Flow - Investing                                       NA         NA         NA          NA       0.00
         Net Cash Flow - Financing                                       NA         NA         NA          NA       0.00

         Source: Capital IQ


         PRICE / VOLUME


                                                                                        Source: Channelchek/QuoteMedia

              Noble Capital Markets' Twenty-First Annual Emerging Growth Equity Conference
   30   31   32   33   34   35   36   37   38   39   40