Page 34 - Basic Statistics
P. 34

29


                            The formula for calculating the variance of the data grouped is


                             p              p     2   
                                                         
                                         
                                          
                              f i ( X i ) −   f i X i    n   / 
                                     2
                                                   
                                          
                            i= 1           i  = 1     
                                                         
                                         
                       2
                       S  =
                                        n − 1


                            The standard deviation for the grouped data is the square root of the
                                                                2
                     variance for the grouped data, ie  S =  S


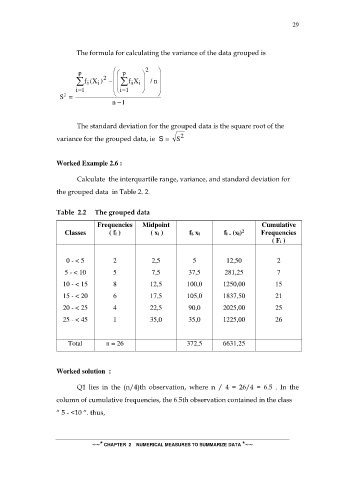
                     Worked Example 2.6 :

                            Calculate  the interquartile range, variance, and standard deviation for

                     the grouped data  in Table 2. 2.


                     Table  2.2     The grouped data

                                   Frequencies     Midpoint                                  Cumulative
                                                                                      2
                        Classes        ( fi )         ( xi )       fi. xi       fi . (xi)    Frequencies
                                                                                                 ( Fi )

                        0 - < 5          2            2,5            5           12,50            2

                        5 - < 10         5            7,5          37,5         281,25            7
                       10 - < 15         8            12,5         100,0       1250,00            15

                       15 - < 20         6            17,5         105,0       1837,50            21

                       20 - < 25         4            22,5         90,0        2025,00            25
                       25 - < 45         1            35,0         35,0        1225,00            26


                         Total        n = 26                       372,5       6631,25


                     Worked solution  :

                            Q1  lies  in  the  (n/4)th  observation,  where  n  /  4  =  26/4  =  6.5  .  In  the

                     column of cumulative frequencies, the 6.5th observation contained in the class

                     “ 5 - <10 “. thus,


                                 ~~* CHAPTER  2    NUMERICAL MEASURES TO SUMMARIZE DATA *~~
   29   30   31   32   33   34   35   36   37   38   39