
Page 69 - Basic Statistics
P. 69
64
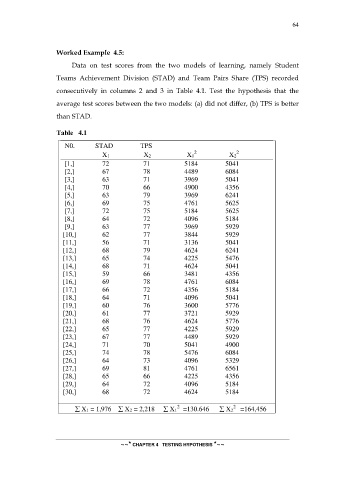
Worked Example 4.5:
Data on test scores from the two models of learning, namely Student
Teams Achievement Division (STAD) and Team Pairs Share (TPS) recorded
consecutively in columns 2 and 3 in Table 4.1. Test the hypothesis that the
average test scores between the two models: (a) did not differ, (b) TPS is better
than STAD.
Table 4.1
N0. STAD TPS
2
2
X1 X2 X1 X2
[1,] 72 71 5184 5041
[2,] 67 78 4489 6084
[3,] 63 71 3969 5041
[4,] 70 66 4900 4356
[5,] 63 79 3969 6241
[6,] 69 75 4761 5625
[7,] 72 75 5184 5625
[8,] 64 72 4096 5184
[9,] 63 77 3969 5929
[10,] 62 77 3844 5929
[11,] 56 71 3136 5041
[12,] 68 79 4624 6241
[13,] 65 74 4225 5476
[14,] 68 71 4624 5041
[15,] 59 66 3481 4356
[16,] 69 78 4761 6084
[17,] 66 72 4356 5184
[18,] 64 71 4096 5041
[19,] 60 76 3600 5776
[20,] 61 77 3721 5929
[21,] 68 76 4624 5776
[22,] 65 77 4225 5929
[23,] 67 77 4489 5929
[24,] 71 70 5041 4900
[25,] 74 78 5476 6084
[26,] 64 73 4096 5329
[27,] 69 81 4761 6561
[28,] 65 66 4225 4356
[29,] 64 72 4096 5184
[30,] 68 72 4624 5184
2
2
X1 = 1,976 X2 = 2,218 X1 =130.646 X2 =164,456
~~* CHAPTER 4 TESTING HYPOTHESIS *~~