
Page 71 - Basic Statistics
P. 71
66
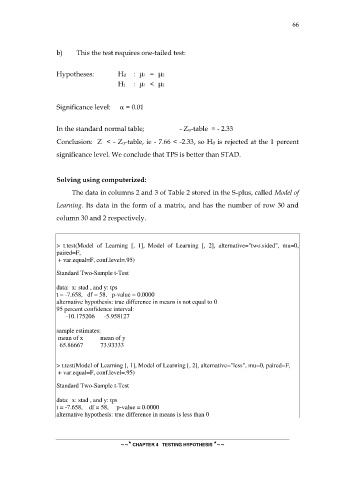
b) This the test requires one-tailed test:
Hypotheses: H0 : μ = μ
1
2
H1 : μ < μ
2
1
Significance level: = 0.01
In the standard normal table; - Z-table = - 2.33
Conclusion: Z < - Z-table, ie - 7.66 < -2.33, so H0 is rejected at the 1 percent
significance level. We conclude that TPS is better than STAD.
Solving using computerized:
The data in columns 2 and 3 of Table 2 stored in the S-plus, called Model of
Learning. Its data in the form of a matrix, and has the number of row 30 and
column 30 and 2 respectively.
> t.test(Model of Learning [, 1], Model of Learning [, 2], alternative="two.sided", mu=0,
paired=F,
+ var.equal=F, conf.level=.95)
Standard Two-Sample t-Test
data: x: stad , and y: tps
t = -7.658, df = 58, p-value = 0.0000
alternative hypothesis: true difference in means is not equal to 0
95 percent confidence interval:
-10.175206 -5.958127
sample estimates:
mean of x mean of y
65.86667 73.93333
> t.test(Model of Learning [, 1], Model of Learning [, 2], alternative="less", mu=0, paired=F,
+ var.equal=F, conf.level=.95)
Standard Two-Sample t-Test
data: x: stad , and y: tps
t = -7.658, df = 58, p-value = 0.0000
alternative hypothesis: true difference in means is less than 0
~~* CHAPTER 4 TESTING HYPOTHESIS *~~