Page 110 - draft
P. 110

Net
                                                Beginning                             Income/(Net
               Fund     Description              Balance     Revenues    Expenditures   Deficit)  Ending Balance
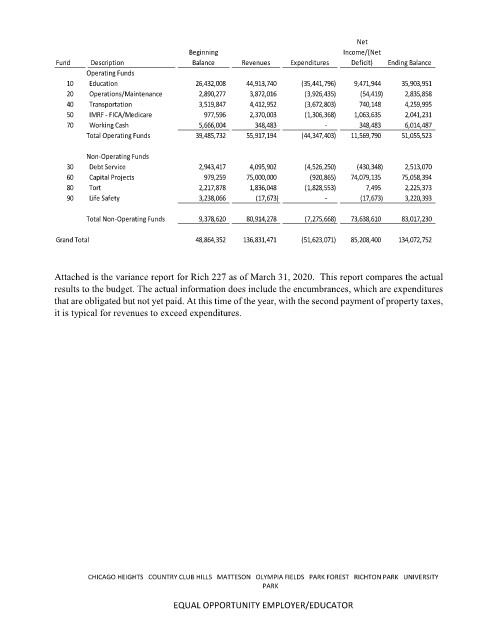
                      Operating Funds
                  10   Education                          26,432,008           44,913,740              (35,441,796)          9,471,944            35,903,951
                  20   Operations/Maintenance                2,890,277              3,872,016                 (3,926,435)              (54,419)               2,835,858
                  40   Transportation                       3,519,847              4,412,952                 (3,672,803)              740,148               4,259,995
                  50   IMRF - FICA/Medicare                     977,596              2,370,003                 (1,306,368)          1,063,635               2,041,231
                  70   Working Cash                         5,666,004                 348,483                               -               348,483               6,014,487
                      Total Operating Funds               39,485,732           55,917,194              (44,347,403)       11,569,790                   51,055,523

                      Non-Operating Funds
                  30   Debt Service                         2,943,417              4,095,902                 (4,526,250)            (430,348)               2,513,070
                  60   Capital Projects                         979,259           75,000,000                    (920,865)        74,079,135            75,058,394
                  80   Tort                                 2,217,878              1,836,048                 (1,828,553)                  7,495               2,225,373
                  90   Life Safety                          3,238,066                  (17,673)                              -               (17,673)               3,220,393

                      Total Non-Operating Funds                9,378,620           80,914,278                 (7,275,668)       73,638,610                   83,017,230

               Grand Total                                48,864,352         136,831,471              (51,623,071)       85,208,400                 134,072,752


               Attached is the variance report for Rich 227 as of March 31, 2020.  This report compares the actual
               results to the budget. The actual information does include the encumbrances, which are expenditures
               that are obligated but not yet paid. At this time of the year, with the second payment of property taxes,
               it is typical for revenues to exceed expenditures.


                       CHICAGO HEIGHTS   COUNTRY CLUB HILLS   MATTESON   OLYMPIA FIELDS   PARK FOREST   RICHTON PARK   UNIVERSITY
                                                                  PARK

                                            EQUAL OPPORTUNITY EMPLOYER/EDUCATOR
   105   106   107   108   109   110   111   112   113   114   115