
Page 67 - draft
P. 67
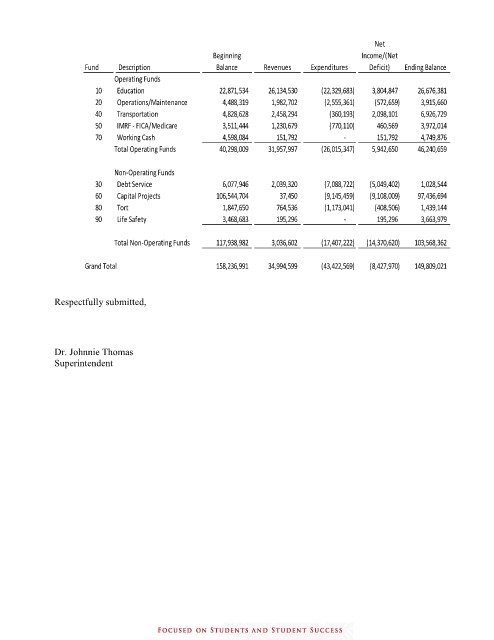
Net
                                                      Beginning                            Income/(Net
                      Fund     Description             Balance    Revenues    Expenditures   Deficit)  Ending Balance
                             Operating Funds
                         10   Education                         22,871,534           26,134,530              (22,329,683)          3,804,847            26,676,381
                         20   Operations/Maintenance                4,488,319              1,982,702                 (2,555,361)            (572,659)               3,915,660
                         40   Transportation                      4,828,628              2,458,294                    (360,193)          2,098,101               6,926,729
                         50   IMRF - FICA/Medicare                3,511,444              1,230,679                    (770,110)              460,569               3,972,014
                         70   Working Cash                        4,598,084                 151,792                               -               151,792               4,749,876
                             Total Operating Funds              40,298,009           31,957,997              (26,015,347)       5,942,650            46,240,659


                             Non-Operating Funds
                         30   Debt Service                        6,077,946              2,039,320                 (7,088,722)        (5,049,402)               1,028,544
                         60   Capital Projects               106,544,704                    37,450                 (9,145,459)        (9,108,009)            97,436,694
                         80   Tort                                1,847,650                 764,536                 (1,173,041)            (408,506)               1,439,144
                         90   Life Safety                         3,468,683                 195,296                               -               195,296               3,663,979


                             Total Non-Operating Funds           117,938,982              3,036,602              (17,407,222)      (14,370,620)               103,568,362

                      Grand Total                            158,236,991           34,994,599              (43,422,569)       (8,427,970)                 149,809,021


               Respectfully submitted,


               Dr. Johnnie Thomas
               Superintendent