
Page 16 - FIN435 RHB vs BPMB
P. 16
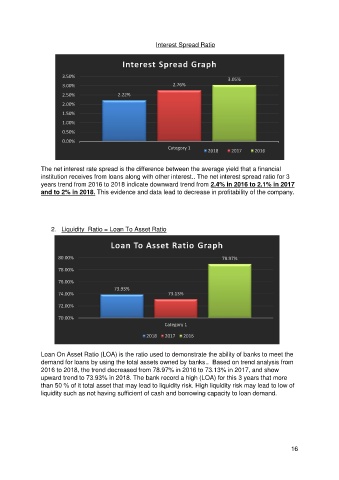
Interest Spread Ratio


                                            Interest Spread Graph

                       3.50%
                                                                                 3.05%
                       3.00%                                  2.76%
                         2.50%            2.22%
                       2.00%

                       1.50%

                       1.00%
                         0.50%

                       0.00%
                                                            Category 1
                                                                          2018    2017    2016

               The net interest rate spread is the difference between the average yield that a financial
               institution receives from loans along with other interest.. The net interest spread ratio for 3
               years trend from 2016 to 2018 indicate downward trend from 2.4% in 2016 to 2.1% in 2017
               and to 2% in 2018. This evidence and data lead to decrease in profitability of the company.


                   2.  Liquidity  Ratio = Loan To Asset Ratio
                                        Loan To Asset Ratio Graph

                      80.00%                                                   78.97%

                      78.00%

                      76.00%
                                         73.93%
                      74.00%                                73.13%
                      72.00%

                      70.00%
                                                           Category 1

                                                    2018   2017  2016


               Loan On Asset Ratio (LOA) is the ratio used to demonstrate the ability of banks to meet the
               demand for loans by using the total assets owned by banks..  Based on trend analysis from
               2016 to 2018, the trend decreased from 78.97% in 2016 to 73.13% in 2017, and show
               upward trend to 73.93% in 2018. The bank record a high (LOA) for this 3 years that more
               than 50 % of it total asset that may lead to liquidity risk. High liquidity risk may lead to low of
               liquidity such as not having sufficient of cash and borrowing capacity to loan demand.


                                                                                                       16