Page 17 - FIN435 RHB vs BPMB
        P. 17
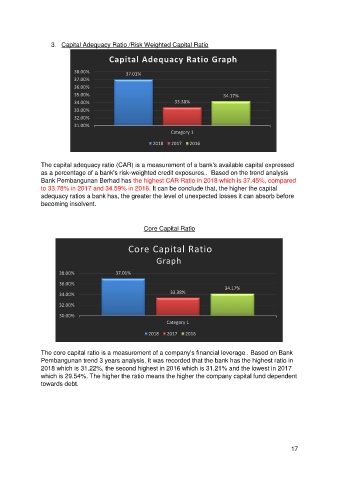
     3.  Capital Adequacy Ratio /Risk Weighted Capital Ratio
                                       Capital Adequacy Ratio Graph
                             38.00%          37.01%
                             37.00%
                             36.00%
                             35.00%                                            34.17%
                             34.00%                           33.38%
                             33.00%
                             32.00%
                            31.00%
                                                             Category 1
                                                       2018  2017   2016
               The capital adequacy ratio (CAR) is a measurement of a bank's available capital expressed
               as a percentage of a bank's risk-weighted credit exposures..  Based on the trend analysis
               Bank Pembangunan Berhad has the highest CAR Ratio in 2018 which is 37.45%, compared
               to 33.78% in 2017 and 34.59% in 2016. It can be conclude that, the higher the capital
               adequacy ratios a bank has, the greater the level of unexpected losses it can absorb before
               becoming insolvent.
                                                    Core Capital Ratio
                                              Core Capital Ratio
                                                        Graph
                      38.00%              37.01%
                      36.00%
                                                             33.38%             34.17%
                      34.00%
                      32.00%
                      30.00%
                                                            Category 1
                                                     2018   2017  2016
               The core capital ratio is a measurement of a company's financial leverage.. Based on Bank
               Pembangunan trend 3 years analysis, it was recorded that the bank has the highest ratio in
               2018 which is 31.22%, the second highest in 2016 which is 31.21% and the lowest in 2017
               which is 29.54%. The higher the ratio means the higher the company capital fund dependent
               towards debt.
                                                                                                       17


