
Page 189 - Shaping A Sustainable Future
P. 189
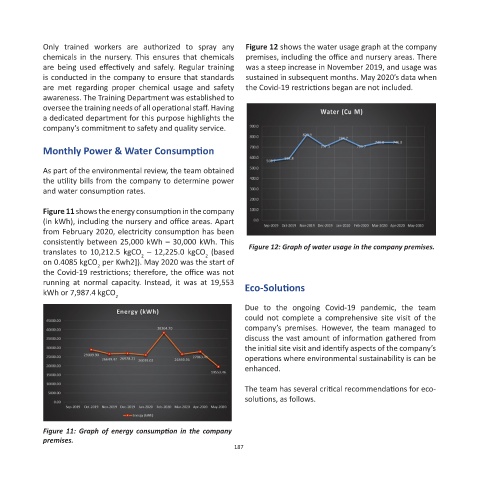
Only  trained  workers  are  authorized  to  spray  any   Figure 12 shows the water usage graph at the company
            chemicals  in  the  nursery.  This  ensures  that  chemicals   premises, including the office and nursery areas. There
            are  being  used  effectively  and  safely.  Regular  training   was a steep increase in November 2019, and usage was
            is conducted in the company to ensure that standards   sustained in subsequent months. May 2020’s data when
            are  met  regarding  proper  chemical  usage  and  safety   the Covid-19 restrictions began are not included.
            awareness. The Training Department was established to
            oversee the training needs of all operational staff. Having
            a dedicated department for this purpose highlights the
            company’s commitment to safety and quality service.

            Monthly Power & Water Consumption


            As part of the environmental review, the team obtained
            the utility bills from the company to determine power
            and water consumption rates.

            Figure 11 shows the energy consumption in the company
            (in kWh), including the nursery and office areas. Apart
            from February 2020, electricity consumption has been
            consistently between 25,000 kWh – 30,000 kWh. This
            translates to  10,212.5 kgCO  – 12,225.0 kgCO  (based   Figure 12: Graph of water usage in the company premises.
                                      2
                                                      2
            on 0.4085 kgCO  per Kwh2]). May 2020 was the start of
                          2
            the Covid-19 restrictions; therefore, the office was not
            running  at  normal  capacity.  Instead,  it  was  at  19,553   Eco-Solutions
            kWh or 7,987.4 kgCO 2
                                                                 Due  to  the  ongoing  Covid-19  pandemic,  the  team
                                                                 could  not  complete  a  comprehensive  site  visit  of  the
                                                                 company’s  premises.  However,  the  team  managed  to
                                                                 discuss the vast amount of information gathered from
                                                                 the initial site visit and identify aspects of the company’s
                                                                 operations where environmental sustainability is can be
                                                                 enhanced.

                                                                 The team has several critical recommendations for eco-
                                                                 solutions, as follows.


            Figure  11:  Graph  of  energy  consumption  in  the  company
            premises.
                                                              187