
Page 114 - Towards A Sustainable Future 2024
P. 114
Affinity law: P2=P1 x(N2/N1)3 N1=1500rpm(before slippage) 1500rpm=120x50/p
Slippage= 2% 2/100 x1500=30
P1/Old Power= 30kW N2:120x40/4=1200rpm(before P=120x50/1500
P2/New Power= 15.36kW slippage)
N1/Old Speed= 1470rpm 2/100 x1200=24
N2/New Speed= 1176rpm P2=30x(1176/1470)^3=15.36kW
Pole= 4
Power Save= 14.64kW Power Save: 30-15.36=14.64kW
Power consumption based on solution Power comparison after the fan application (Daily, i.e.
24Hrs)
AHU power consumption: 15.36kW x 12 hours= 184.32kWh
AHU power saved: 14.64kW x 24 hours= 175.68kWh AHU (40Hz) + 4 Fan (12hrs) power consumption: 184.32kWh
EuropAce Air Purifying Bladeless Fan (EBF Z3) x 4 power + 1.68kWh= 186kWh
consumption:
Proposed Power Usage: 186kWh, 75.4602 KgCO2, 27,542.973
KgCO2 (annually)
35/1000 x 12 hours x 4 fans=1.68kWh
Total Power Saved: 30kW x 12 hours= 360kWh(AHU’s VSD
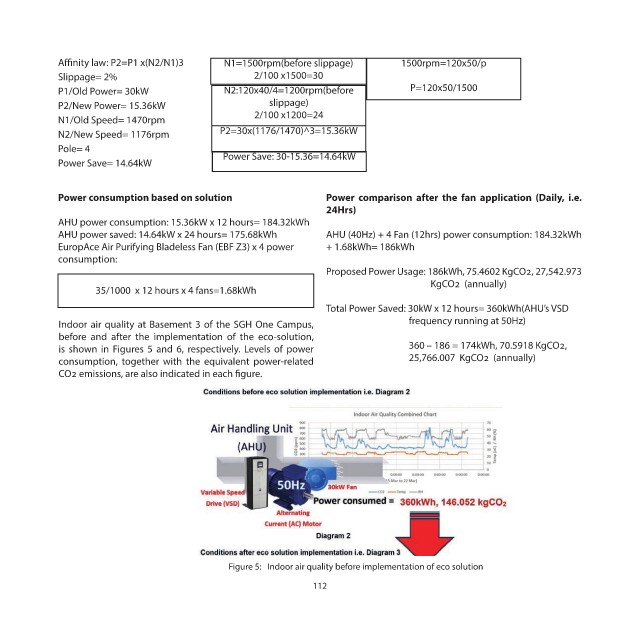
Indoor air quality at Basement 3 of the SGH One Campus, frequency running at 50Hz)
before and after the implementation of the eco-solution,
is shown in Figures 5 and 6, respectively. Levels of power 360 – 186 = 174kWh, 70.5918 KgCO2,
consumption, together with the equivalent power-related 25,766.007 KgCO2 (annually)
CO2 emissions, are also indicated in each figure.
Figure 5: Indoor air quality before implementation of eco solution
112