
Page 115 - Towards A Sustainable Future 2024
P. 115
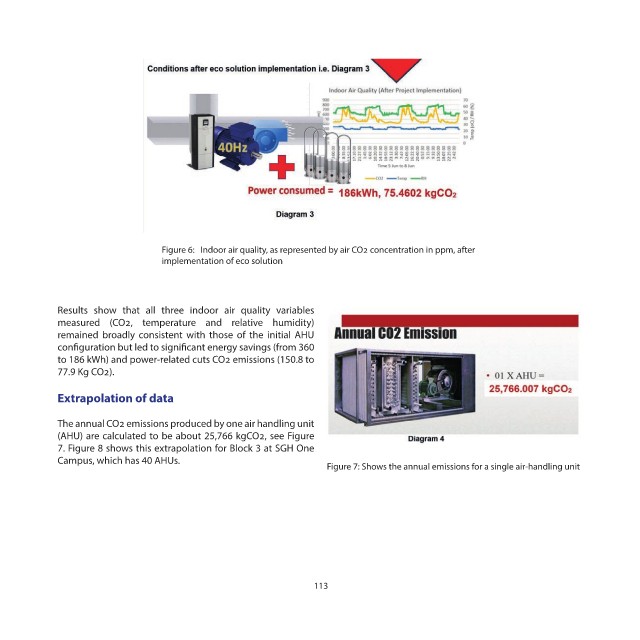
Figure 6:   Indoor air quality, as represented by air CO2 concentration in ppm, after
                                 implementation of eco solution


            Results show that all three indoor air quality variables
            measured (CO2, temperature and relative humidity)
            remained broadly consistent with those of the initial AHU
            configuration but led to significant energy savings (from 360
            to 186 kWh) and power-related cuts CO2 emissions (150.8 to
            77.9 Kg CO2).


            Extrapolation of data

            The annual CO2 emissions produced by one air handling unit
            (AHU) are calculated to be about 25,766 kgCO2, see Figure
            7. Figure 8 shows this extrapolation for Block 3 at SGH One
            Campus, which has 40 AHUs.
                                                                 Figure 7: Shows the annual emissions for a single air-handling unit


                                                              113