
Page 44 - Padfolio
P. 44
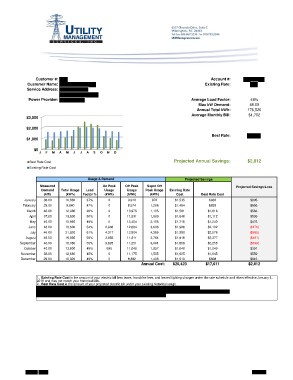
Customer #:                                                                                           Account #:    49%
Customer Name:                                                                                         Existing Rate:    48.00
Service Address:                                                                                                        176,520
                                                                                             Average Load Factor:       $1,702
 Power Provider:                                                                                  Max kW Demand:
                                                                                                 Annual Total kWh:
$3,000
$2,000                                                                                       Average Monthly Bill:
$1,000
                                                                                             Best Rate:
     $0

Best Rate Cost                                                                Projected Annual Savings:                 $2,812
Existing Rate Cost

                                 Usage & Demand                               Projected Savings

               Measured  Total Usage Load    On Peak  Off Peak   Super Off    Existing Rate  Best Rate Cost             Projected Savings/Loss
                Demand       (kWh) Factor %   Usage    Usage    Peak Usage          Cost            $930
                                              (kWh)    (kWh)                                        $839                             $605
                  (kW)                                              (kWh)          $1,535          $1,016                            $656
                                                  0                                $1,494          $1,112                            $566
    January       36.00  10,880  37%              0   9,910     970                $1,581          $1,240                            $536
  February        29.00                           0                                $1,648          $2,102                            $476
                  46.00  9,840   47%              0   8,574     1,266              $1,716          $2,576                           ($176)
      March       37.00                           0                                $1,926          $2,377                           ($586)
        April     46.00  12,080  38%           2,908  10,975    1,105              $1,990          $2,258                           ($461)
         May      48.00                        4,317                               $1,916          $1,249                           ($399)
        June      46.00  13,800  50%           3,985  11,831    1,969              $1,859          $1,045                            $391
         July     46.00                        3,828                               $1,640           $868                             $559
                  46.00  15,560  49%            695   13,454    2,106              $1,605                                            $645
     August       40.00                           0                                $1,513       $17,611
September         38.00  18,600  54%              0   12,684    3,008                                                            $2,812
                  29.00                                                         $20,423
    October              21,520  61%                  12,804    4,399
November
December                 19,560  59%                  11,811    3,764

                         18,080  55%                  11,251    3,001

                         13,600  49%                  11,048    1,857

                         12,680  45%                  11,175    1,505

                         10,320  49%                  8,882     1,438

                                                                Annual Cost:

               1. Existing Rate Cost is the amount of your electric bill less taxes, franchise fees, and leased lighting charges under the rate schedule and riders effective January 1,
               2016 and may not match your historical bills.
               2. Best Rate Cost is the amount of your projected electric bill under your existing historical usage.