
Page 80 - 2017academicreport
P. 80
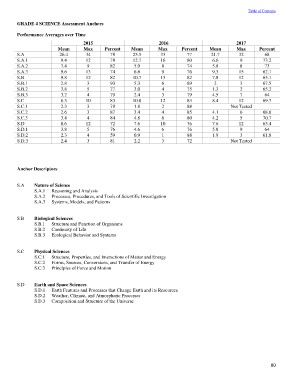
Table of Contents

GRADE 4 SCIENCE Assessment Anchors

Performance Averages over Time

S.A    Mean   2015                  Percent  Mean   2016                          Percent  Mean      2017     Percent
S.A.1   26.4  Max                      78     25.5  Max                              77     21.7     Max         68
S.A.2   9.4    34                      78     12.7   33                              80     6.6        32       73.2
S.A.3   7.4    12                      82     5.9    16                              74     5.8                  73
S.B     9.6                            74     6.6                                    76     9.3        9        62.1
S.B.1   9.8     9                      82     10.7    8                              82     7.8        8        65.1
S.B.2   2.8    13                      93     5.3     9                              89                15       67.5
S.B.3   3.8    12                      77     3.0    13                              75      2         12       65.2
S.C     3.2     3                      79     2.4     6                              79     1.3        3         64
S.C.1   8.3     5                      83     10.0    4                              83     4.5        2        69.7
S.C.2   2.3     4                      78     1.8     3                              88     8.4        7
S.C.3   2.6    10                      87     3.4    12                              85                12       68.6
S.D     3.4     3                      84     4.8     2                              80     4.1   Not Tested    70.7
S.D.1   8.6     3                      72     7.6     4                              76     4.2        6        63.4
S.D.2   3.8     4                      76     4.6     6                              76     7.6        5         64
S.D.3   2.3    12                      59     0.9    10                              88     5.8        12       61.8
        2.4     5                      81     2.2     6                              72     1.9        9
                4                                     1                                                3
                3                                     3                                           Not Tested

Anchor Descriptors

S.A Nature of Science
          S.A.1 Reasoning and Analysis
          S.A.2 Processes, Procedures, and Tools of Scientific Investigation
          S.A.3 Systems, Models, and Patterns

S.B Biological Sciences
          S.B.1 Structure and Function of Organisms
          S.B.2 Continuity of Life
          S.B.3 Ecological Behavior and Systems

S.C Physical Sciences
          S.C.1 Structure, Properties, and Interactions of Matter and Energy
          S.C.2 Forms, Sources, Conversions, and Transfer of Energy
          S.C.3 Principles of Force and Motion

S.D Earth and Space Sciences
          S.D.1 Earth Features and Processes that Change Earth and its Resources
          S.D.2 Weather, Climate, and Atmospheric Processes
          S.D.3 Composition and Structure of the Universe

                                                                                                              80