
Page 16 - Annual Report of Achievement & Growth
P. 16
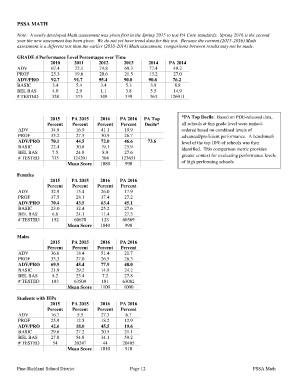
PSSA MATH

Note: A newly developed Math assessment was given first in the Spring 2015 to test PA Core standards. Spring 2016 is the second
year the new assessment has been given. We do not yet have trend data for this test. Because the current (2015-2016) Math
assessment is a different test than the earlier (2010-2014) Math assessment, comparisons between results may not be made.

GRADE 4 Performance Level Percentages over Time

           2010     2011            2012     2013         2014  PA 2014
                                                          77.4    49.2
ADV        67.4 72.1 74.8 69.3                            13.2    27.0
                                                          90.6    76.2
PROF       25.3 19.6 20.6 21.5                             3.9     8.8
                                                           5.5    14.9
ADV/PRO 92.7        91.7            95.4     90.8         363
                                                                126911
BASIC      3.4 5.4 3.4 5.3

BEL BAS    4.0                 2.9  1.1      3.8

# TESTED   328                 373  349      339

ADV        2015       PA 2015        2016    PA 2016  PA Top    *PA Top Decile: Based on PDE-released data,
PROF      Percent      Percent      Percent  Percent  Decile*   all schools at this grade level were ranked-
ADV/PRO                                                         ordered based on combined levels of
BASIC       34.9         16.9         41.1     19.9     73.6    advanced/proficient performance. A benchmark
BEL BAS     35.2         27.5         30.9     26.7             level of the top 10% of schools was then
# TESTED    70.1         44.5         72.0     46.6             identified. This comparison metric provides
            22.4         30.8         19.1     25.9             greater context for evaluating performance levels
             7.5         24.8          8.9     27.6             of high performing schools.
            335        124201         304    123651
                    Mean Score       1080       990

Females    2015       PA 2015        2016    PA 2016
          Percent      Percent      Percent  Percent
ADV
PROF        32.9         15.4         26.0     17.9
ADV/PRO     37.5         28.1         37.4     27.2
BASIC       70.4         43.5         63.4     45.1
BEL BAS     23.0         32.4         25.2     27.6
# TESTED     6.6         24.1         11.4     27.3
            152         60670         123     60569
                    Mean Score       1040       990

Males      2015       PA 2015        2016    PA 2016
          Percent      Percent      Percent  Percent
ADV
PROF        36.6         18.4         51.4     21.7
ADV/PRO     33.3         27.0         26.5     26.3
BASIC       69.9         45.4         77.9     48.0
BEL BAS     21.9         29.2         14.9     24.2
# TESTED     8.2         25.4          7.2     27.8
            183         63509         181     63082
                    Mean Score       1100      1000

Students with IEPs

           2015       PA 2015        2016    PA 2016
                       Percent      Percent  Percent
          Percent
                          5.5         27.3      6.7
ADV        16.7          12.5         18.2     12.9
                         18.0         45.5     19.6
PROF       25.9          27.2         20.5     21.1
                         54.8         34.1     59.2
ADV/PRO 42.6            20247          44     20405
                    Mean Score       1010       910
BASIC      29.6

BEL BAS    27.8

# TESTED   54

Pine-Richland School District                    Page 12                 PSSA Math