
Page 901 - Kitab3DsMax
P. 901
Chapter 34: Using Animation Layers, Modifiers, and Complex Controllers
Bias values in the fields below the graph changes its shape. Right-clicking the track and selecting Properties
from the pop-up menu opens the TCB graph dialog box, shown in Figure 34.22.
FIGURE 34.22
This dialog box shows, and lets you control, a curve defined by the Tension, Continuity, and Bias values.
The Tension value controls the amount of curvature: High Tension values produce a straight line leading
into and away from the key, and low Tension values produce a round curve. The Continuity value controls
how continuous, or smooth, the curve is around the key: The default value of 25 produces the smoothest
curves, whereas high and low Continuity values produce sharp peaks from the top or bottom. The Bias
value controls how the curve comes into and leaves the key point, with high Bias values causing a bump to
the right of the key and low Bias values causing a bump to the left.
The Ease To and Ease From values control how quickly the key is approached or left.
Note
Enabling the trajectory path by clicking the Trajectory button in the Motion panel lets you see the changes to the
path as they are made in the Key Info rollout. n
Figure 34.23 shows three TCB curves assigned to the Position track of an object.
Note
Some controllers are assigned through the Animation menu and others through the Assign Controller dialog box.
Look to both if you cannot find a specific controller. n
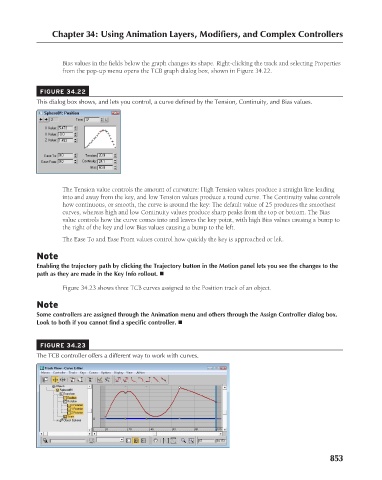
FIGURE 34.23
The TCB controller offers a different way to work with curves.
853