
Page 13 - Gi_August2019
P. 13
In 2018, their demand was 72 per cent FIGURE 1 LOCAL GAS NETWORKS LINEPACK IN GWH (HOURLY DATA)
(544TWh) of Britain’s total gas demand
(minus exports) of 753TWh.
GDN pipelines are about 265,000km
in length and also contain some higher-
pressure pipelines that have linepack
that can be varied in pressure.
Gas pipelines become smaller in
diameter and lower in pressure as
they get closer to end users, and by the
time the gas is utilised in a domestic
property its operating pressure will only
be slightly above atmospheric pressure.
Although hourly historical linepack
data for the NTS has been available for
some time, the data for GDNs has not. The
FlexiNET project collated and aggregated
this proprietary hourly linepack data
from the four networks, providing a
clearer picture across Britain’s combined http://www.ukerc.ac.uk/publications/linepack.html
transmission and distribution gas a measure of the storage that can be for that following gas day.
infrastructure for the first time. utilised as an inherent characteristic Linepack is therefore constantly
of having a gaseous energy vector monitored and adjusted dependent on
What is linepack flexibility contained in a high-pressure pipeline changing conditions such as the weather.
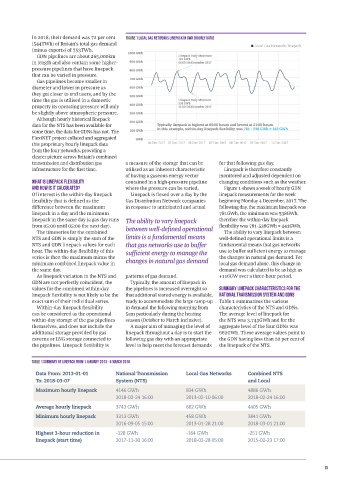
and how is it calculated? where the pressure can be varied. Figure 1 shows a week of hourly GDN
Of interest is the within-day linepack Linepack is flexed over a day by the linepack measurements for the week
flexibility that is defined as the Gas Distribution Network companies beginning Monday 4 December, 2017. The
difference between the maximum in response to anticipated and actual following day, the maximum linepack was
linepack in a day and the minimum 781GWh, the minimum was 538GWh,
linepack in the same day (a gas day runs The ability to vary linepack therefore the within-day linepack
from 05:00 until 05:00 the next day). between well-defined operational flexibility was 781-538GWh = 243GWh.
The timeseries for the combined The ability to vary linepack between
NTS and GDN is simply the sum of the limits is a fundamental means well-defined operational limits is a
NTS and GDN linepack values for each that gas networks use to buffer fundamental means that gas networks
hour. The within-day flexibility of this sufficient energy to manage the use to buffer sufficient energy to manage
series is then the maximum minus the the changes in natural gas demand. For
minimum combined linepack value in changes in natural gas demand local gas demand alone, this change in
the same day. demand was calculated to be as high as
As linepack variation in the NTS and patterns of gas demand. +116GW over a three-hour period.
GDN are not perfectly coincident, the Typically, the amount of linepack in
values for the combined within-day the pipelines is increased overnight so Summary linepack characteristics for the
linepack flexibility is not likely to be the that additional stored energy is available, national transmission system and GDNs
exact sum of their individual series. ready to accommodate the large ramp-up Table 1 summarises the various
Within-day linepack flexibility in demand the following morning from characteristics of the NTS and GDNs.
can be considered as the operational 5am particularly during the heating The average level of linepack for
within-day storage of the gas pipelines season (October to March inclusive). the NTS was 3,743GWh and for the
themselves, and does not include the A major aim of managing the level of aggregate level of the four GDNs was
additional storage provided by gas linepack throughout a day is to start the 662GWh. These average values point to
caverns or LNG storage connected to following gas day with an appropriate the GDN having less than 20 per cent of
the pipelines. Linepack flexibility is level to help meet the forecast demands the linepack of the NTS.
TABLE 1 SUMMARY OF LINEPACK FROM 1 JANUARY 2013 - 6 MARCH 2018
http://www.ukerc.ac.uk/publications/linepack.html 13
UKERCLinepackPaper.indd 2 18/07/2019 15:07