
Page 10 - SHEET PRIM 4 1ST TERM
P. 10
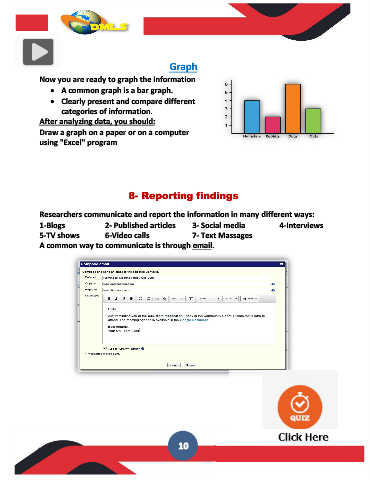
Graph

              Now you are ready to graph the information
                 •  A common graph is a bar graph.
                 •  Clearly present and compare different
                     categories of information.
              After analyzing data, you should:
              Draw a graph on a paper or on a computer
              using "Excel" program


                                           8- Reporting findings


              Researchers communicate and report the information in many different ways:
              1-Blogs              2- Published articles        3- Social media              4-Interviews
              5-TV shows           6-Video calls                7- Text Massages
              A common way to communicate is through email.


                                                            10