
Page 211 - Thailand Post Annual Report 2024
P. 211
Part 1
Overview of the Organization
Part 2
Business Trends
Part 3
Business Model
Part 4
Strategies and Resource Allocation
Part 5
Risk
Part 6
Corporate Governance
Part 7
Operating Results
Part 8
Other Information
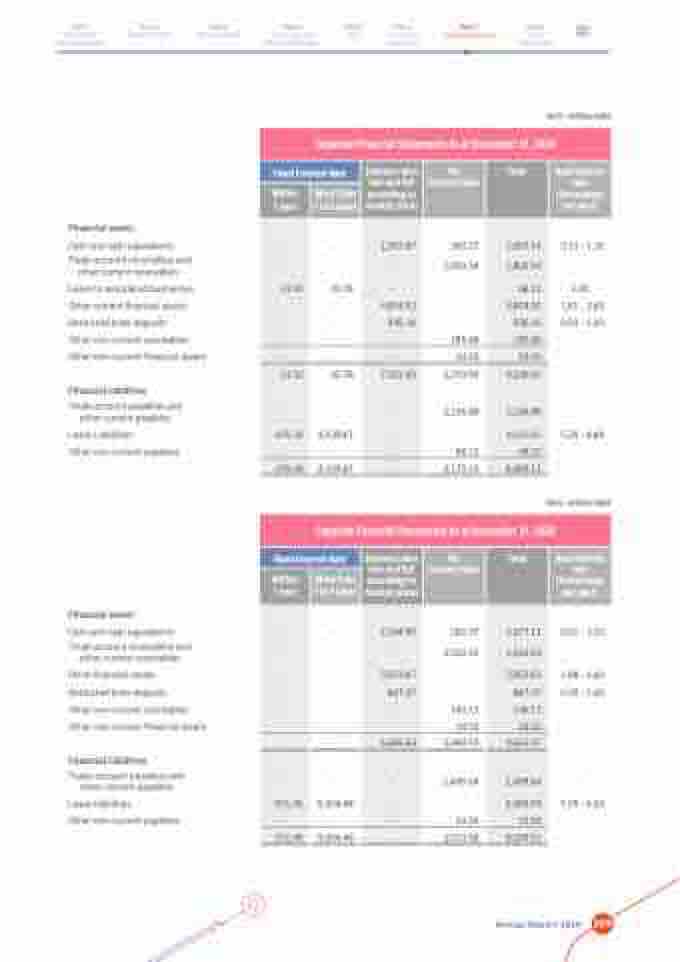
Unit : million baht
0.13 - 1.15 -
2.40 1.81 - 2.65 0.50 - 1.45
- -
-
5.25 - 6.68 -
Unit : million baht
0.01 - 2.20 -
1.88 - 2.60 0.35 - 1.45
- -
-
5.25 - 6.24 -
Separate Financial Statements As at December 31, 2024
Fixed Interest Rate
Interest rates rise and fall according to market prices
No Interest Rate
Total
Real interest rate (Percentage per year)
Within 1 year
More than 1to5years
-
-
1,392.87
260.27
1,653.14
-
-
-
1,800.54
1,800.54
23.33
42.78
-
-
66.11
-
-
4,874.92
-
4,874.92
-
-
935.16
-
935.16
-
-
-
185.68
185.68
-
-
-
24.50
24.50
23.33
42.78
7,202.95
2,270.99
9,540.05
-
-
-
2,106.88
2,106.88
470.34
4,039.67
-
-
4,510.01
-
-
-
68.22
68.22
470.34
4,039.67
-
2,175.10
6,685.11
Financial assets
Cash and cash equivalents
Trade account receivables and other current receivables
Loans to associated businesses Other current financial assets Restricted bank deposits
Other non-current receivables Other non-current financial assets
Financial liabilities
Trade account payables and other current payables
Lease Liabilities
Other non-current payables
Separate Financial Statements As at December 31, 2023
Fixed Interest Rate
Interest rates rise and fall according to market prices
No Interest Rate
Total
Real interest rate (Percentage per year)
Within 1 year
More than 1to5years
-
-
2,264.80
262.37
2,527.17
-
-
-
2,542.53
2,542.53
-
-
3,553.67
-
3,553.67
-
-
867.37
-
867.37
-
-
-
140.13
140.13
24.50
24.50
-
-
6,685.84
2,969.53
9,655.37
-
-
-
2,499.64
2,499.64
531.45
5,054.48
-
-
5,585.93
-
-
-
23.94
23.94
531.45
5,054.48
-
2,523.58
8,109.51
Financial assets
Cash and cash equivalents
Trade account receivables and other current receivables
Other financial assets
Restricted bank deposits
Other non-current receivables Other non-current financial assets
Financial liabilities
Trade account payables and other current payables
Lease liabilities
Other non-current payables
Annual Report 2024 209
