
Page 46 - MIN ECEM
P. 46
A15
LOCAL Thursday 15 June 2017
Trade via Containers in the Region’s Ports Falls 0.9% in 2016
-ECLAC’s new ports rank- high degree of heteroge- tina. Meanwhile, the west
ing confirms the decline in neity in this activity’s growth coast shows a rebound in
the region’s foreign trade rates within the region. container activity (4.5%)
last year and marks a loss in The deceleration in the when compared with the
activity not seen since the regional average of port growth rate seen in 2015
crisis of 2009. throughput began several (0.4%), due to the positive
years ago: 6.0% in 2012, evolution of port terminals
SANTIAGO, CHILE - The 1.3% in 2013, 2.4% in 2014 in Chile (4.8%), Peru (8.4%)
throughput of container- and 2.5% in 2015. and Ecuador (4.5%).
ized cargo in the ports of The deterioration in 2016 At the same time, Cen-
Latin America and the was mainly determined by tral America went from a
Caribbean fell 0.9% in a decline in activity in five positive growth rate in 2015
2016, according to data countries: Brazil (-4.4%), (3.4%) to a 3.5% decline
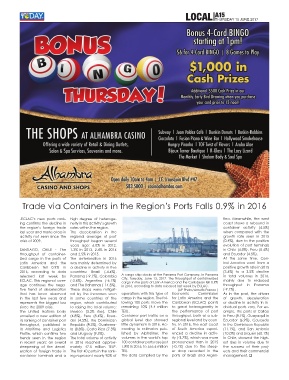
released last week by Panama (-9.1%), Colombia A cargo ship docks at the Panama Port Company, in Panama in total volumes in 2016,
City, Tuesday, June 13, 2017. The throughput of containerized
ECLAC. This regional aver- (-3.6%), Argentina (-6.1%) cargo in the ports of Latin America and the Caribbean fell 0.9% mainly due to reduced
age continues the nega- and The Bahamas (-14.3%). in 2016, according to data released last week by ECLAC. throughput in Panama
tive trend of deceleration These drops were mitigat- (AP Photo/Arnulfo Franco ) (-9.1%).
that has been observed ed by the increases seen operations with this type of Economic Commission As in the past, the drivers
in the last few years and in some countries of the cargo in the region. The fol- for Latin America and the of growth, deceleration
represents the biggest loss region, which contributed lowing 100 ports move the Caribbean (ECLAC) points or decline in activity in in-
since the 2009 crisis. to raising the total volume: remaining 10% (4.4 million to great heterogeneity in dividual ports vary. For ex-
The United Nations body Mexico (3.2% rise), Chile TEU). the performance of port ample, the ports of Callao
unveiled a new edition of (4.8%), Peru (8.4%), Ecua- Container port traffic on a throughput, both at a sub- in Peru (8.1%), Guayaquil in
its ranking of container port dor (4.5%), the Dominican global level also showed regional level and by coun- Ecuador (6.9%), Caucedo
throughput, published in Republic (8.3%), Guatema- little dynamism in 2016. Ac- try. In 2016, the east coast in the Dominican Republic
its Maritime and Logistics la (8.8%), Costa Rica (7.3%) cording to estimates pub- of South America experi- (11.1%), and San Antonio
Profile, which confirms two and Uruguay (9.5%). lished by Alphaliner, the enced a decline in activ- (10.0%) and Lirquén (60.1%)
trends seen in the region The total volume of activity volumes in the world’s top ity (-3.7%), which was more in Chile, showed the high-
in recent years: an overall in 2016 reached approxi- 100 container ports rose just pronounced than in 2015 est rises in volume due to
steepening of the decel- mately 47.5 million TEU*. 1.8% in 2016, to 555.6 million (-0.7%) due to the steep- the success of their proj-
eration of foreign trade in The first 40 ports in the rank- TEU. er drop recorded in the ects and their commercial
container terminals and a ing represent nearly 90% of The data compiled by the ports of Brazil and Argen- management. q