
Page 11 - PAPER PRESENTATION 2ND
P. 11
PAPER PRESENTATION 2019
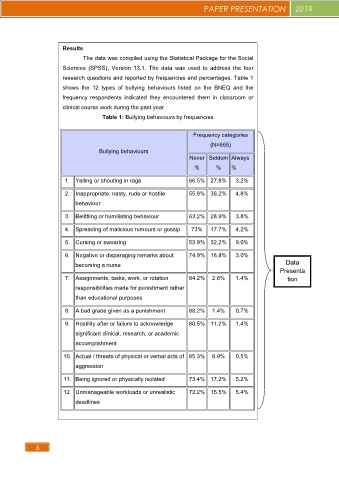
Results
The data was compiled using the Statistical Package for the Social
Sciences (SPSS), Version 13.1. The data was used to address the four
research questions and reported by frequencies and percentages. Table 1
shows the 12 types of bullying behaviours listed on the BNEQ and the
frequency respondents indicated they encountered them in classroom or
clinical course work during the past year.
Table 1: Bullying behaviours by frequencies
Frequency categories
(N=665)
Bullying behaviours
Never Seldom Always
% % %
1. Yelling or shouting in rage 66.5% 27.8% 3.2%
2. Inappropriate, nasty, rude or hostile 55.8% 36.2% 4.8%
behaviour
3. Belittling or humiliating behaviour 63.2% 28.9% 3.8%
4. Spreading of malicious rumours or gossip 73% 17.7% 4.2%
5. Cursing or swearing 53.9% 32.2% 9.0%
6. Negative or disparaging remarks about 74.9% 16.8% 3.0%
becoming a nurse Data
Presenta
7. Assignments, tasks, work, or rotation 84.2% 2.6% 1.4% tion
responsibilities made for punishment rather
than educational purposes
8. A bad grade given as a punishment 88.2% 1.4% 0.7%
9. Hostility after or failure to acknowledge 80.5% 11.2% 1.4%
significant clinical, research, or academic
accomplishment
10. Actual / threats of physical or verbal acts of 85.3% 6.9% 0.5%
aggression
11. Being ignored or physically isolated 73.4% 17.2% 5.2%
12. Unmanageable workloads or unrealistic 72.2% 15.5% 5.4%
deadlines
8