
Page 130 - PAPER PRESENTATION 2ND
P. 130
PAPER PRESENTATION 2019
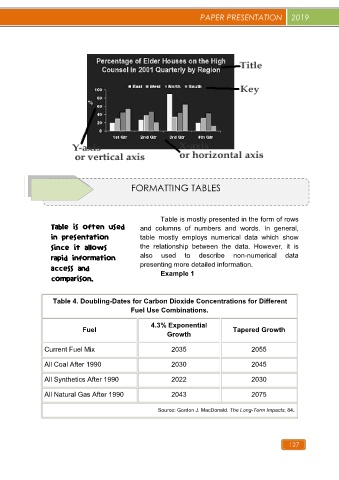
FORMATTING TABLES
Table is mostly presented in the form of rows
and columns of numbers and words. In general,
Table is often used
table mostly employs numerical data which show
in presentation
the relationship between the data. However, it is
since it allows
also used to describe non-numerical data
rapid information
presenting more detailed information.
access and
Example 1
comparison.
Table 4. Doubling-Dates for Carbon Dioxide Concentrations for Different
Fuel Use Combinations.
4.3% Exponential
Fuel Tapered Growth
Growth
Current Fuel Mix 2035 2055
All Coal After 1990 2030 2045
All Synthetics After 1990 2022 2030
All Natural Gas After 1990 2043 2075
Source: Gordon J. MacDonald. The Long-Term Impacts, 84.
127