
Page 90 - PAPER PRESENTATION 2ND
P. 90
PAPER PRESENTATION 2019
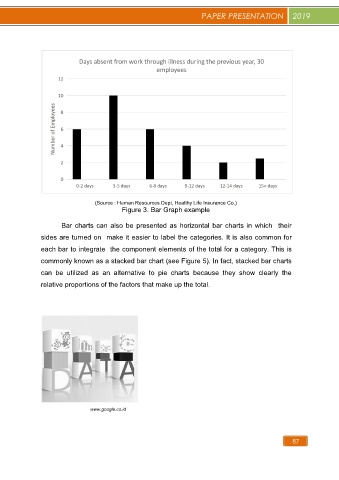
(Source : Human Resources Dept, Healthy Life Insurance Co.)
Figure 3. Bar Graph example
Bar charts can also be presented as horizontal bar charts in which their
sides are turned on make it easier to label the categories. It is also common for
each bar to integrate the component elements of the total for a category. This is
commonly known as a stacked bar chart (see Figure 5). In fact, stacked bar charts
can be utilized as an alternative to pie charts because they show clearly the
relative proportions of the factors that make up the total.
www.google.co.id
87