
Page 93 - PAPER PRESENTATION 2ND
P. 93
PAPER PRESENTATION 2019
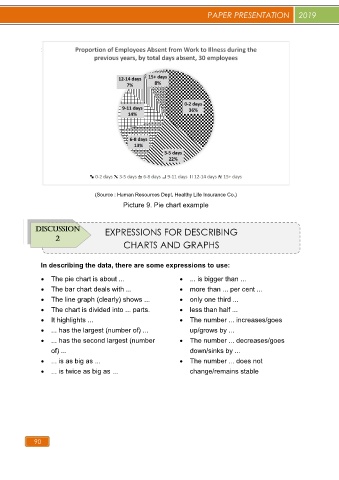
(Source : Human Resources Dept, Healthy Life Insurance Co.)
Picture 9. Pie chart example
DISCUSSION EXPRESSIONS FOR DESCRIBING
2
CHARTS AND GRAPHS
In describing the data, there are some expressions to use:
The pie chart is about ... ... is bigger than ...
The bar chart deals with ... more than ... per cent ...
The line graph (clearly) shows ... only one third ...
The chart is divided into ... parts. less than half ...
It highlights ... The number ... increases/goes
... has the largest (number of) ... up/grows by ...
... has the second largest (number The number ... decreases/goes
of) ... down/sinks by ...
... is as big as ... The number ... does not
... is twice as big as ... change/remains stable
90