
Page 96 - PAPER PRESENTATION 2ND
P. 96
PAPER PRESENTATION 2019
ACTIVITY DESCRIBING QUANTITATIVE DATA
1
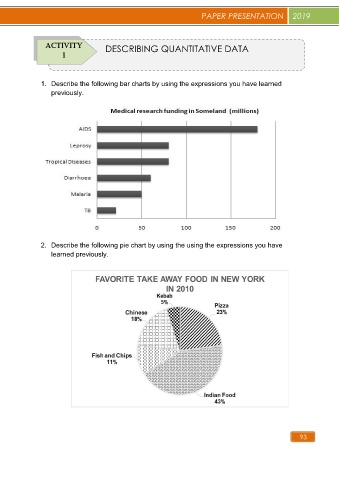
1. Describe the following bar charts by using the expressions you have learned
previously.
2. Describe the following pie chart by using the using the expressions you have
learned previously.
93