
Page 95 - PAPER PRESENTATION 2ND
P. 95
PAPER PRESENTATION 2019
Example 2
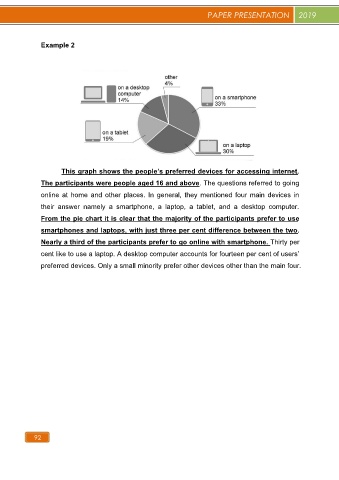
This graph shows the people’s preferred devices for accessing internet.
The participants were people aged 16 and above. The questions referred to going
online at home and other places. In general, they mentioned four main devices in
their answer namely a smartphone, a laptop, a tablet, and a desktop computer.
From the pie chart it is clear that the majority of the participants prefer to use
smartphones and laptops, with just three per cent difference between the two.
Nearly a third of the participants prefer to go online with smartphone. Thirty per
cent like to use a laptop. A desktop computer accounts for fourteen per cent of users’
preferred devices. Only a small minority prefer other devices other than the main four.
92