
Page 531 - TaxAdviser_2022
P. 531
■ Office, field, large business, and Audit rates over time
international cases, including high-
wealth individuals;
Tax
Tax
■ Correspondence exams; and year year Change
in
■ Underreporter inquiries (CP 2000).
2017 2010 coverage
Normally, a taxpayer who qualifies for
the earned income tax credit (EITC) has Individual income tax
income under $100,000. The relatively returns, total 0.5% 1.0% -50.5%
high audit rate for the EITC includes
Size of total positive income:
the IRS EITC anti-fraud initiatives.
No total positive income 6.8% 20.6% -67.1%
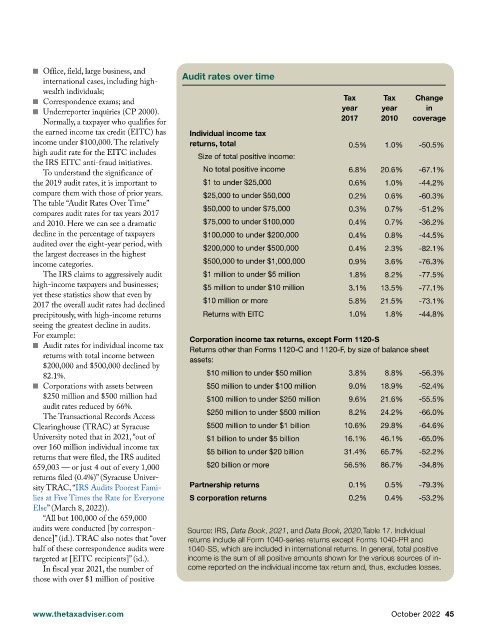
To understand the significance of
the 2019 audit rates, it is important to $1 to under $25,000 0.6% 1.0% -44.2%
compare them with those of prior years. $25,000 to under $50,000 0.2% 0.6% -60.3%
The table “Audit Rates Over Time”
$50,000 to under $75,000 0.3% 0.7% -51.2%
compares audit rates for tax years 2017
$75,000 to under $100,000 0.4% 0.7% -36.2%
and 2010. Here we can see a dramatic
decline in the percentage of taxpayers $100,000 to under $200,000 0.4% 0.8% -44.5%
audited over the eight-year period, with
$200,000 to under $500,000 0.4% 2.3% -82.1%
the largest decreases in the highest
$500,000 to under $1,000,000 0.9% 3.6% -76.3%
income categories.
The IRS claims to aggressively audit $1 million to under $5 million 1.8% 8.2% -77.5%
high-income taxpayers and businesses; $5 million to under $10 million 3.1% 13.5% -77.1%
yet these statistics show that even by
$10 million or more 5.8% 21.5% -73.1%
2017 the overall audit rates had declined
precipitously, with high-income returns Returns with EITC 1.0% 1.8% -44.8%
seeing the greatest decline in audits.
For example: Corporation income tax returns, except Form 1120-S
■ Audit rates for individual income tax
Returns other than Forms 1120-C and 1120-F, by size of balance sheet
returns with total income between
assets:
$200,000 and $500,000 declined by
$10 million to under $50 million 3.8% 8.8% -56.3%
82.1%.
■ Corporations with assets between $50 million to under $100 million 9.0% 18.9% -52.4%
$250 million and $500 million had $100 million to under $250 million 9.6% 21.6% -55.5%
audit rates reduced by 66%.
$250 million to under $500 million 8.2% 24.2% -66.0%
The Transactional Records Access
Clearinghouse (TRAC) at Syracuse $500 million to under $1 billion 10.6% 29.8% -64.6%
University noted that in 2021, “out of $1 billion to under $5 billion 16.1% 46.1% -65.0%
over 160 million individual income tax
$5 billion to under $20 billion 31.4% 65.7% -52.2%
returns that were filed, the IRS audited
$20 billion or more 56.5% 86.7% -34.8%
659,003 — or just 4 out of every 1,000
returns filed (0.4%)” (Syracuse Univer-
Partnership returns 0.1% 0.5% -79.3%
sity TRAC, “IRS Audits Poorest Fami-
lies at Five Times the Rate for Everyone S corporation returns 0.2% 0.4% -53.2%
Else” (March 8, 2022)).
“All but 100,000 of the 659,000
audits were conducted [by correspon- Source: IRS, Data Book, 2021, and Data Book, 2020,Table 17. Individual
dence]” (id.). TRAC also notes that “over returns include all Form 1040-series returns except Forms 1040-PR and
half of these correspondence audits were 1040-SS, which are included in international returns. In general, total positive
targeted at [EITC recipients]” (id.). income is the sum of all positive amounts shown for the various sources of in-
come reported on the individual income tax return and, thus, excludes losses.
In fiscal year 2021, the number of
those with over $1 million of positive
www.thetaxadviser.com October 2022 45