
Page 357 - COSO Guidance Book
P. 357
Thought Leadership in ERM | Risk Assessment in Practice | 15
Risk Maps
Another simple way to view the portfolio is to create a After plotting on the heat map, risks are then ranked from
risk map, often called a heat map. These are usually two- highest to lowest in terms of risk level. These rankings
dimensional representations of impact plotted against may then be adjusted based on other considerations such
likelihood. They can also depict other relationships such as as vulnerability, speed of onset, or detailed knowledge of
impact versus vulnerability. For even richer information, the the nature of the impact. For example, within a group of
size of the data points can reflect a third variable such as risks having a designation of very high, those risks having
speed of onset or the degree of uncertainty in the estimates. extreme health and safety or reputational impacts may be
prioritized over risks having extreme financial impacts but
The most common way to prioritize risks is by designating lesser health and safety or reputational impacts.
a risk level for each area of the graph such as very high,
high, medium, or low, where the higher the combined When using numerical ratings in a qualitative environment,
impact and likelihood ratings, the higher the overall risk it’s important to remember that the numbers are labels and
level. The boundaries between levels vary from entity to not suitable for mathematical manipulation although some
entity depending on risk appetite. For example, an entity entities do multiply the ratings, such as for impact and
with a greater risk appetite will have boundaries between likelihood, to develop a preliminary ranking.
risk levels shifted toward the upper right, and an entity with
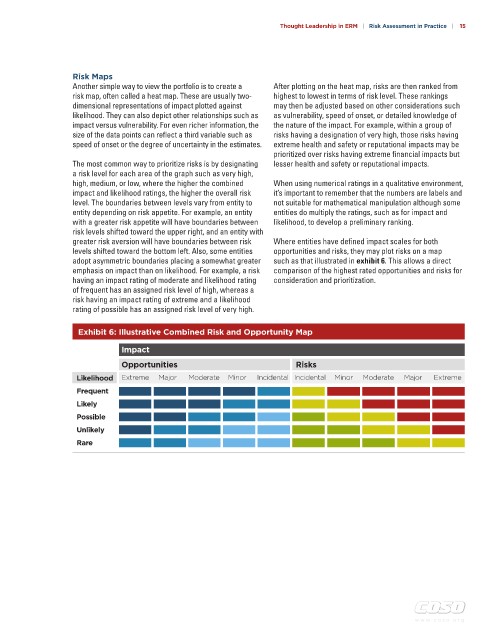
greater risk aversion will have boundaries between risk Where entities have defined impact scales for both
levels shifted toward the bottom left. Also, some entities opportunities and risks, they may plot risks on a map
adopt asymmetric boundaries placing a somewhat greater such as that illustrated in exhibit 6. This allows a direct
emphasis on impact than on likelihood. For example, a risk comparison of the highest rated opportunities and risks for
having an impact rating of moderate and likelihood rating consideration and prioritization.
of frequent has an assigned risk level of high, whereas a
risk having an impact rating of extreme and a likelihood
rating of possible has an assigned risk level of very high.
Exhibit 6: Illustrative Combined Risk and Opportunity Map
Impact
Opportunities Risks
Likelihood Extreme Major Moderate Minor Incidental Incidental Minor Moderate Major Extreme
Frequent
Likely
Possible
Unlikely
Rare
w w w . c o s o . o r g