
Page 354 - COSO Guidance Book
P. 354
12 | Risk Assessment in Practice | Thought Leadership in ERM
Assess Risk Interactions
ERM enables an integrated and holistic view of risks. The into supply chain risk) and then assigning ownership and
key here is that the whole does not equal the sum of the oversight for the risk area. Three explicit ways to capture
parts. To understand portfolio risk, one must understand the risk interactions increasing in level of complexity and
risks of the individual elements plus their interactions due richness of information are risk interaction maps, correlation
to the presence of natural hedges and mutually amplifying matrices, and bow-tie diagrams.
risks. Understanding risk interactions and then managing
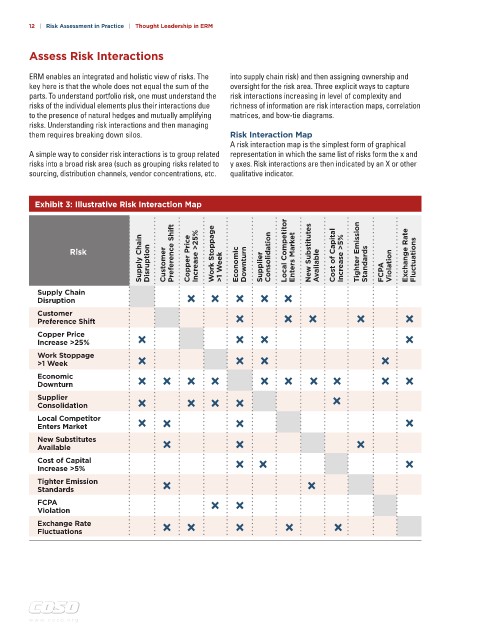
them requires breaking down silos. Risk Interaction Map
A risk interaction map is the simplest form of graphical
A simple way to consider risk interactions is to group related representation in which the same list of risks form the x and
risks into a broad risk area (such as grouping risks related to y axes. Risk interactions are then indicated by an X or other
sourcing, distribution channels, vendor concentrations, etc. qualitative indicator.
Exhibit 3: Illustrative Risk Interaction Map
Supply Chain Disruption Customer Copper Price Increase >25% >1 Week Economic Downturn Supplier Consolidation Enters Market Available Increase >5% Standards FCPA Violation Fluctuations
Risk Preference Shift Work Stoppage Local Competitor New Substitutes Cost of Capital Tighter Emission Exchange Rate
Supply Chain
Disruption
Customer
Preference Shift
Copper Price
Increase >25%
Work Stoppage
>1 Week
Economic
Downturn
Supplier
Consolidation
Local Competitor
Enters Market
New Substitutes
Available
Cost of Capital
Increase >5%
Tighter Emission
Standards
FCPA
Violation
Exchange Rate
Fluctuations
w w w . c o s o . o r g