
Page 30 - Dec 2021 Report
P. 30
December Report
Investment/Finance Committee meeting minutes (draft) (3) Prime continues to have confidence in Coronation and Semper Vic and recommends JSF retain these
investments.
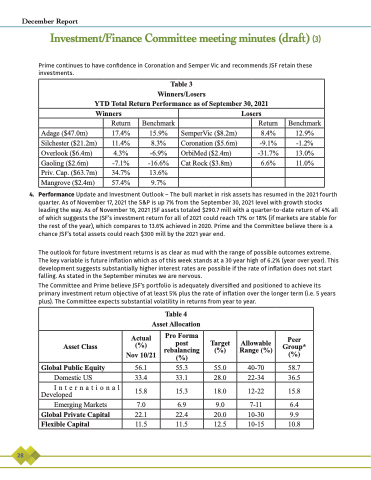
Table 3
Winners/Losers
YTD Total Return Performance as of September 30, 2021
Winners
Losers
Return
Benchmark
Return
Benchmark
Adage ($47.0m)
17.4%
15.9%
SemperVic ($8.2m)
8.4%
12.9%
Silchester ($21.2m)
11.4%
8.3%
Coronation ($5.6m)
-9.1%
-1.2%
Overlook ($6.4m)
4.3%
-6.9%
OrbiMed ($2.4m)
-31.7%
13.0%
Gaoling ($2.6m)
-7.1%
-16.6%
Cat Rock ($3.8m)
6.6%
11.0%
Priv. Cap. ($63.7m)
34.7%
13.6%
Mangrove ($2.4m)
57.4%
9.7%
4. PerformanceUpdateandInvestmentOutlook–Thebullmarketinriskassetshasresumedinthe2021fourth quarter. As of November 17, 2021 the S&P is up 7% from the September 30, 2021 level with growth stocks leading the way. As of November 16, 2021 JSF assets totaled $290.7 mill with a quarter-to-date return of 4% all of which suggests the JSF’s investment return for all of 2021 could reach 17% or 18% (if markets are stable for the rest of the year), which compares to 13.6% achieved in 2020. Prime and the Committee believe there is a chance JSF’s total assets could reach $300 mill by the 2021 year end.
The outlook for future investment returns is as clear as mud with the range of possible outcomes extreme. The key variable is future inflation which as of this week stands at a 30 year high of 6.2% (year over year). This development suggests substantially higher interest rates are possible if the rate of inflation does not start falling. As stated in the September minutes we are nervous.
The Committee and Prime believe JSF’s portfolio is adequately diversified and positioned to achieve its primary investment return objective of at least 5% plus the rate of inflation over the longer term (i.e. 5 years plus). The Committee expects substantial volatility in returns from year to year.
Table 4 Asset Allocation
Asset Class
Actual (%)
Nov 10/21
Pro Forma post rebalancing (%)
Target (%)
Allowable Range (%)
Peer Group* (%)
Global Public Equity
56.1
55.3
55.0
40-70
58.7
Domestic US
33.4
33.1
28.0
22-34
36.5
International Developed
15.8
15.3
18.0
12-22
15.8
Emerging Markets
7.0
6.9
9.0
7-11
6.4
Global Private Capital
22.1
22.4
20.0
10-30
9.9
Flexible Capital
11.5
11.5
12.5
10-15
10.8
28
