
Page 370 - The Toxicology of Fishes
P. 370
350 The Toxicology of Fishes
TABLE 7.5
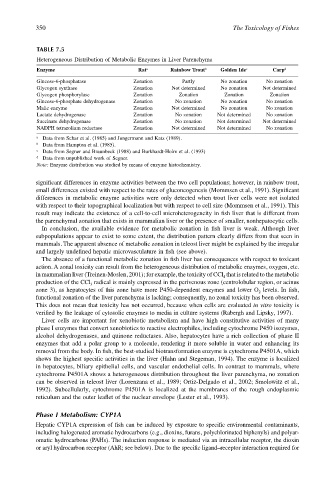
Heterogeneous Distribution of Metabolic Enzymes in Liver Parenchyma
Enzyme Rat a Rainbow Trout b Golden Ide c Carp d
Glucose-6-phosphatase Zonation Partly No zonation No zonation
Glycogen synthase Zonation Not determined No zonation Not determined
Glycogen phosphorylase Zonation Zonation Zonation Zonation
Glucose-6-phosphate dehydrogenase Zonation No zonation No zonation No zonation
Malic enzyme Zonation Not determined No zonation No zonation
Lactate dehydrogenase Zonation No zonation Not determined No zonation
Succinate dehydrogenase Zonation No zonation Not determined Not determined
NADPH tetrazolium reductase Zonation Not determined Not determined No zonation
a Data from Schar et al. (1985) and Jungermann and Katz (1989).
b Data from Hampton et al. (1985).
c Data from Segner and Braunbeck (1988) and Burkhardt-Holm et al. (1993)
d Data from unpublished work of Segner.
Note: Enzyme distribution was studied by means of enzyme histochemistry.
significant differences in enzyme activities between the two cell populations; however, in rainbow trout,
small differences existed with respect to the rates of gluconeogenesis (Mommsen et al., 1991). Significant
differences in metabolic enzyme activities were only detected when trout liver cells were not isolated
with respect to their topographical localization but with respect to cell size (Mommsen et al., 1991). This
result may indicate the existence of a cell-to-cell microheterogeneity in fish liver that is different from
the parenchymal zonation that exists in mammalian liver or the presence of smaller, nonhepatocytic cells.
In conclusion, the available evidence for metabolic zonation in fish liver is weak. Although liver
subpopulations appear to exist to some extent, the distribution pattern clearly differs from that seen in
mammals. The apparent absence of metabolic zonation in teleost liver might be explained by the irregular
and largely undefined hepatic microvasculature in fish (see above).
The absence of a functional metabolic zonation in fish liver has consequences with respect to toxicant
action. A zonal toxicity can result from the heterogeneous distribution of metabolic enzymes, oxygen, etc.
in mammalian liver (Treinen-Moslen, 2001); for example, the toxicity of CCl that is related to the metabolic
4
production of the CCl radical is mainly expressed in the perivenous zone (centrolobular region, or acinus
3
zone 3), as hepatocytes of this zone have more P450-dependent enzymes and lower O levels. In fish,
2
functional zonation of the liver parenchyma is lacking; consequently, no zonal toxicity has been observed.
This does not mean that toxicity has not occurred, because when cells are evaluated in vitro toxicity is
verified by the leakage of cytosolic enzymes to media in culture systems (Rabergh and Lipsky, 1997).
Liver cells are important for xenobiotic metabolism and have high constitutive activities of many
phase I enzymes that convert xenobiotics to reactive electrophiles, including cytochrome P450 isozymes,
alcohol dehydrogenases, and quinone reductases. Also, hepatocytes have a rich collection of phase II
enzymes that add a polar group to a molecule, rendering it more soluble in water and enhancing its
removal from the body. In fish, the best-studied biotransformation enzyme is cytochrome P4501A, which
shows the highest specific activities in the liver (Hahn and Stegeman, 1994). The enzyme is localized
in hepatocytes, biliary epithelial cells, and vascular endothelial cells. In contrast to mammals, where
cytochrome P4501A shows a heterogeneous distribution throughout the liver parenchyma, no zonation
can be observed in teleost liver (Lorenzana et al., 1989; Ortiz-Delgado et al., 2002; Smolowitz et al.,
1992). Subcellularly, cytochrome P4501A is localized at the membranes of the rough endoplasmic
reticulum and the outer leaflet of the nuclear envelope (Lester et al., 1993).
Phase I Metabolism: CYP1A
Hepatic CYP1A expression of fish can be induced by exposure to specific environmental contaminants,
including halogenated aromatic hydrocarbons (e.g., dioxins, furans, polychlorinated biphenyls) and polyar-
omatic hydrocarbons (PAHs). The induction response is mediated via an intracellular receptor, the dioxin
or aryl hydrocarbon receptor (AhR; see below). Due to the specific ligand–receptor interaction required for