
Page 686 - The Toxicology of Fishes
P. 686
666 The Toxicology of Fishes
100
Percent Effect or Response (e.g., mortality)
0
Concentration of Test Chemical
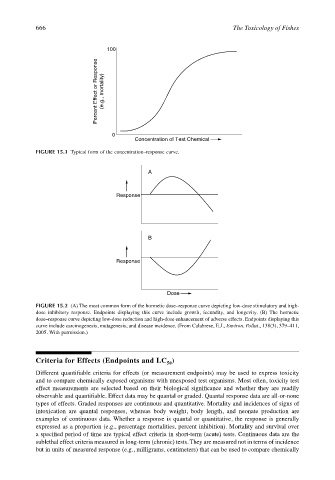
FIGURE 15.1 Typical form of the concentration–response curve.
A
Response
B
Response
Dose
FIGURE 15.2 (A) The most common form of the hormetic dose–response curve depicting low-dose stimulatory and high-
dose inhibitory response. Endpoints displaying this curve include growth, fecundity, and longevity. (B) The hormetic
dose–response curve depicting low-dose reduction and high-dose enhancement of adverse effects. Endpoints displaying this
curve include carcinogenesis, mutagenesis, and disease incidence. (From Calabrese, E.J., Environ. Pollut., 138(3), 379–411,
2005. With permission.)
Criteria for Effects (Endpoints and LC )
50
Different quantifiable criteria for effects (or measurement endpoints) may be used to express toxicity
and to compare chemically exposed organisms with unexposed test organisms. Most often, toxicity test
effect measurements are selected based on their biological significance and whether they are readily
observable and quantifiable. Effect data may be quantal or graded. Quantal response data are all-or-none
types of effects. Graded responses are continuous and quantitative. Mortality and incidences of signs of
intoxication are quantal responses, whereas body weight, body length, and neonate production are
examples of continuous data. Whether a response is quantal or quantitative, the response is generally
expressed as a proportion (e.g., percentage mortalities, percent inhibition). Mortality and survival over
a specified period of time are typical effect criteria in short-term (acute) tests. Continuous data are the
sublethal effect criteria measured in long-term (chronic) tests. They are measured not in terms of incidence
but in units of measured response (e.g., milligrams, centimeters) that can be used to compare chemically