
Page 687 - The Toxicology of Fishes
P. 687
Fish Toxicity Studies 667
100
Percent Mortality 75
50
25
0
0 40 80 120 160 200 20 50 100 200
LC50
A B
99.9 8
99
7
90
6
Percent Mortality 50 5 Probits
4
10
3
1
0.1 2
30 50 100
LC50
Concentration (mg/L or ppm) of Test Chemical
C
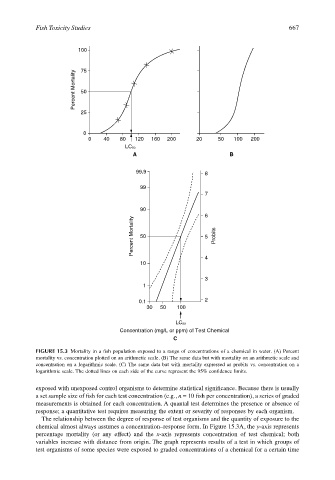
FIGURE 15.3 Mortality in a fish population exposed to a range of concentrations of a chemical in water. (A) Percent
mortality vs. concentration plotted on an arithmetic scale. (B) The same data but with mortality on an arithmetic scale and
concentration on a logarithmic scale. (C) The same data but with mortality expressed as probits vs. concentration on a
logarithmic scale. The dotted lines on each side of the curve represent the 95% confidence limits.
exposed with unexposed control organisms to determine statistical significance. Because there is usually
a set sample size of fish for each test concentration (e.g., n = 10 fish per concentration), a series of graded
measurements is obtained for each concentration. A quantal test determines the presence or absence of
response; a quantitative test requires measuring the extent or severity of responses by each organism.
The relationship between the degree of response of test organisms and the quantity of exposure to the
chemical almost always assumes a concentration–response form. In Figure 15.3A, the y-axis represents
percentage mortality (or any effect) and the x-axis represents concentration of test chemical; both
variables increase with distance from origin. The graph represents results of a test in which groups of
test organisms of some species were exposed to graded concentrations of a chemical for a certain time