
Page 168 - Veterinary Toxicology, Basic and Clinical Principles, 3rd Edition
P. 168
Toxicokinetics Chapter | 8 135
VetBooks.ir EMPIRICAL (COMPARTMENTAL) 16
TOXICOKINETIC MODELS
8
Introduction
Empirical compartmental pharmacokinetic models Ln (concentration) 4
describe the aggregate result of all the processes involved
in determining the concentration/time curve of a com- 2
pound in a reference compartment, which is most often
the venous blood, and referred to as the central compart-
1
ment. It uses single or multiple compartments and 0 2 4 6 8 10 12 14 16
first-order rate equations, chosen to optimally describe Time
experimental data, with no direct physiological relevance
or fidelity to anatomical structure or physiology. The FIGURE 8.1 First-order decline in plasma concentrations on a semilog-
arithmic scale, according to a one-compartment model.
main use of these models is to predict plasma concentra-
tions in exposure conditions that are similar to the condi-
tions under which the data were produced from which the 16
model was derived. Traditionally, exponential equations
have been used to quantitatively describe the changes in
8
concentrations of toxic substances in plasma and tissue
over time (Riviere, 2011; Gibaldi and Perrier, 1982). Compartment 1
Typical biexponential equation used to describe Arbitrary units 4
time concentration data of xenobiotics in plasma: Compartment 2
CtðÞ 5 Ae 2α 3 t 1 Be 2β 3 t 2
where C(t) is the xenobiotic concentration at time t, α and
β are the slopes of the two phases with different disap- 1
0 10 20 30 40
pearance rates, and A and B are their intercepts with the
Time
y-axis.
In these models, the body is viewed as comprising one
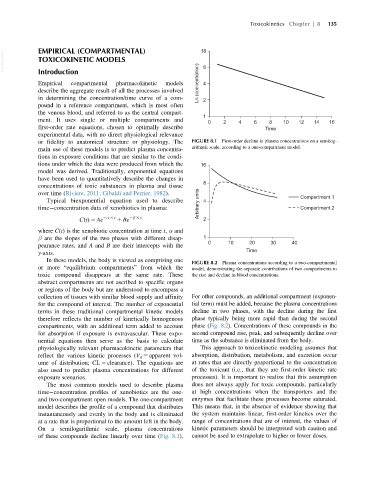
FIGURE 8.2 Plasma concentrations according to a two-compartmental
or more “equilibrium compartments” from which the model, demonstrating the separate contributions of two compartments to
toxic compound disappears at the same rate. These the rise and decline in blood concentrations.
abstract compartments are not ascribed to specific organs
or regions of the body but are understood to encompass a
collection of tissues with similar blood supply and affinity For other compounds, an additional compartment (exponen-
for the compound of interest. The number of exponential tial term) must be added, because the plasma concentrations
terms in these traditional compartmental kinetic models decline in two phases, with the decline during the first
therefore reflects the number of kinetically homogenous phase typically being more rapid than during the second
compartments, with an additional term added to account phase (Fig. 8.2). Concentrations of these compounds in the
for absorption if exposure is extravascular. These expo- second compound rise, peak, and subsequently decline over
nential equations then serve as the basis to calculate time as the substance is eliminated from the body.
physiologically relevant pharmacokinetic parameters that This approach to toxicokinetic modeling assumes that
reflect the various kinetic processes (V d 5 apparent vol- absorption, distribution, metabolism, and excretion occur
ume of distribution; CL 5 clearance). The equations are at rates that are directly proportional to the concentration
also used to predict plasma concentrations for different of the toxicant (i.e., that they are first-order kinetic rate
exposure scenarios. processes). It is important to realize that this assumption
The most common models used to describe plasma does not always apply for toxic compounds, particularly
time concentration profiles of xenobiotics are the one- at high concentrations when the transporters and the
and two-compartment open models. The one-compartment enzymes that facilitate these processes become saturated.
model describes the profile of a compound that distributes This means that, in the absence of evidence showing that
instantaneously and evenly in the body and is eliminated the system maintains linear, first-order kinetics over the
at a rate that is proportional to the amount left in the body. range of concentrations that are of interest, the values of
On a semilogarithmic scale, plasma concentrations kinetic parameters should be interpreted with caution and
of these compounds decline linearly over time (Fig. 8.1). cannot be used to extrapolate to higher or lower doses.