Page 736 - Veterinary Toxicology, Basic and Clinical Principles, 3rd Edition
P. 736
Brominated Flame Retardants and Perfluorinated Chemicals Chapter | 52  701


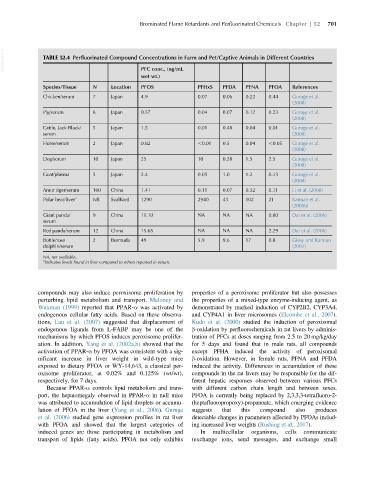
  VetBooks.ir  TABLE 52.4 Perfluorinated Compound Concentrations in Farm and Pet/Captive Animals in Different Countries


                                               PFC conc., (ng/mL
                                               wet wt.)
               Species/Tissue  N     Location  PFOS               PFHxS   PFDA   PFNA    PFOA   References
               Chicken/serum   7     Japan     4.9                0.07    0.06   0.22    0.44   Guruge et al.
                                                                                                (2008)
               Pig/serum       6     Japan     0.57               0.04    0.07   0.12    0.23   Guruge et al.
                                                                                                (2008)
               Cattle, Jack Black/  5  Japan   1.5                0.01    0.48   0.04    0.01   Guruge et al.
               serum                                                                            (2008)
               Horse/serum     2     Japan     0.82               ,0.01   0.5    0.04    ,0.05  Guruge et al.
                                                                                                (2008)
               Dog/serum       10    Japan     25                 10      0.28   1.5     2.5    Guruge et al.
                                                                                                (2008)
               Goat/plasma     5     Japan     2.4                0.05    1.0    1.2     0.13   Guruge et al.
                                                                                                (2008)
               Amur tiger/serum  100  China    1.41               0.11    0.07   0.32    0.11   Li et al. (2008)
               Polar bear/liver a  NR  Svalbard  1290             2940    43     102     21     Kannan et al.
                                                                                                (2005b)
               Giant panda/    9     China     11.10              NA      NA     NA      0.80   Dai et al. (2006)
               serum
               Red panda/serum  12   China     15.65              NA      NA     NA      2.29   Dai et al. (2006)
               Bottlenose      2     Bermuda   49                 5.9     9.6    17      0.8    Giesy and Kannan
               dolphin/serum                                                                    (2001)
               NA, not available.
               a Indicates levels found in liver compared to others reported in serum.


             compounds may also induce peroxisome proliferation by  properties of a peroxisome proliferator but also possesses
             perturbing lipid metabolism and transport. Maloney and  the properties of a mixed-type enzyme-inducing agent, as
             Waxman (1999) reported that PPAR-α was activated by  demonstrated by marked induction of CYP2B2, CYP3A4,
             endogenous cellular fatty acids. Based on these observa-  and CYP4A1 in liver microsomes (Elcombe et al., 2007).
             tions, Lau et al. (2007) suggested that displacement of  Kudo et al. (2000) studied the induction of peroxisomal
             endogenous ligands from L-FABP may be one of the   β-oxidation by perfluorochemicals in rat livers by adminis-
             mechanisms by which PFOS induces peroxisome prolifer-  tration of PFCs at doses ranging from 2.5 to 20 mg/kg/day
             ation. In addition, Yang et al. (2002a,b) showed that the  for 5 days and found that in male rats, all compounds
             activation of PPAR-α by PFOA was consistent with a sig-  except PFHA induced the activity of peroxisomal
             nificant increase in liver weight in wild-type mice  β-oxidation. However, in female rats, PFNA and PFDA
             exposed to dietary PFOA or WY-14,643, a classical per-  induced the activity. Differences in accumulation of these
             oxisome proliferator, at 0.02% and 0.125% (wt/wt),  compounds in the rat livers may be responsible for the dif-
             respectively, for 7 days.                          ferent hepatic responses observed between various PFCs
                Because PPAR-α controls lipid metabolism and trans-  with different carbon chain length and between sexes.
             port, the hepatomegaly observed in PPAR-α in null mice  PFOA is currently being replaced by 2,3,3,3-tetrafluoro-2-
             was attributed to accumulation of lipid droplets or accumu-  (heptafluoropropoxy)-propanoate, which emerging evidence
             lation of PFOA in the liver (Yang et al., 2006). Guruge  suggests  that  this  compound  also  produces
             et al. (2006) studied gene expression profiles in rat liver  detectable changes in parameters affected by PFOAs includ-
             with PFOA and showed that the largest categories of  ing increased liver weights (Rushing et al., 2017).
             induced genes are those participating in metabolism and  In  multicellular  organisms,  cells  communicate
             transport of lipids (fatty acids). PFOA not only exhibits  (exchange ions, send messages, and exchange small

