
Page 723 - Small Animal Internal Medicine, 6th Edition
P. 723
CHAPTER 41 Acute Kidney Injury and Chronic Kidney Disease 695
mechanisms responsible for the adaptive changes have by glomerular filtration and some combination of tubular
adverse effects on the animal. reabsorption and secretion (e.g., sodium, potassium), but
VetBooks.ir Bricker in 1972, as follows: “The biological price to be paid normal plasma concentrations of these solutes are main-
This trade-off hypothesis was articulated by Dr. Neil
tained until the GFR decreases below 5% of normal or until
for maintaining external solute balance for a given solute as
renal disease progresses is the induction of one or more oliguria or anuria develops.
abnormalities of the uremic state.” Hyperfiltration is an DEVELOPMENT OF POLYURIA
example of the trade-off hypothesis in that total GFR is pre- AND POLYDIPSIA
served, but at the expense of proteinuria, glomerular sclero- The ability to produce concentrated urine (i.e., conserve
sis, and progressive deterioration of residual renal tissue. water) and the ability to excrete a water load are impaired in
Another classic example is the maintenance of normal CKD. The development of this concentrating defect is her-
calcium and phosphorus balance by renal secondary hyper- alded clinically by the onset of PU and compensatory PD.
parathyroidism but at the expense of bone density. Buffering Increased solute load per residual functioning nephron
of accumulated fixed acid by bone carbonate at the expense rather than architectural damage to the tubules and intersti-
of bone density is yet another example. Some maladaptive tium is the single most important factor contributing to the
mechanisms and their consequences can be prevented by a concentrating defect—that is, the remnant nephrons are
proportional reduction in the intake of the solute in ques- functioning under conditions of osmotic diuresis. In most
tion. This strategy will avoid the need for the kidneys to alter cases, defective concentrating ability develops when 67% of
fractional reabsorption and excretion of the solute being the nephron population has become nonfunctional and is
manipulated. Using this approach with dietary phosphorus recognized clinically by isosthenuria, a urine osmolality of
has been shown to prevent or reverse renal secondary hyper- 300 to 600 mOsm/kg or USG of 1.007 to 1.015. The example
parathyroidism and slow the progression of CKD. in Box 41.5 demonstrates how PU develops in CKD, despite
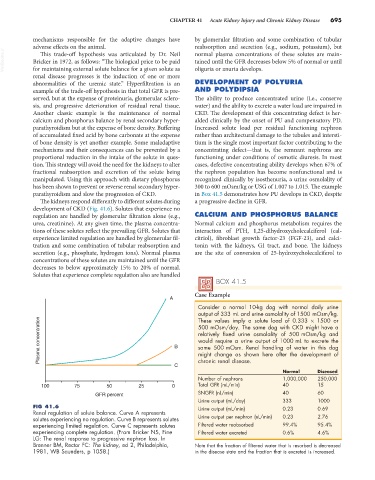
The kidneys respond differently to different solutes during a progressive decline in GFR.
development of CKD (Fig. 41.6). Solutes that experience no
regulation are handled by glomerular filtration alone (e.g., CALCIUM AND PHOSPHORUS BALANCE
urea, creatinine). At any given time, the plasma concentra- Normal calcium and phosphorus metabolism requires the
tions of these solutes reflect the prevailing GFR. Solutes that interaction of PTH, 1,25-dihydroxycholecalciferol (cal-
experience limited regulation are handled by glomerular fil- citriol), fibroblast growth factor-23 (FGF-23), and calci-
tration and some combination of tubular reabsorption and tonin with the kidneys, GI tract, and bone. The kidneys
secretion (e.g., phosphate, hydrogen ions). Normal plasma are the site of conversion of 25-hydroxycholecalciferol to
concentrations of these solutes are maintained until the GFR
decreases to below approximately 15% to 20% of normal.
Solutes that experience complete regulation also are handled
BOX 41.5
Case Example
A
Consider a normal 10-kg dog with normal daily urine
output of 333 mL and urine osmolality of 1500 mOsm/kg.
Plasma concentration B 500 mOsm/day. The same dog with CKD might have a
These values imply a solute load of 0.333 × 1500 or
relatively fixed urine osmolality of 500 mOsm/kg and
would require a urine output of 1000 mL to excrete the
same 500 mOsm. Renal handling of water in this dog
chronic renal disease.
C might change as shown here after the development of
Normal Diseased
Number of nephrons 1,000,000 250,000
100 75 50 25 0 Total GFR (mL/min) 40 15
GFR percent SNGFR (nL/min) 40 60
Urine output (mL/day) 333 1000
FIG 41.6 Urine output (mL/min) 0.23 0.69
Renal regulation of solute balance. Curve A represents
solutes experiencing no regulation. Curve B represents solutes Urine output per nephron (nL/min) 0.23 2.76
experiencing limited regulation. Curve C represents solutes Filtered water reabsorbed 99.4% 95.4%
experiencing complete regulation. (From Bricker NS, Fine Filtered water excreted 0.6% 4.6%
LG: The renal response to progressive nephron loss. In
Brenner BM, Rector FC: The kidney, ed 2, Philadelphia, Note that the fraction of filtered water that is resorbed is decreased
1981, WB Saunders, p 1058.) in the disease state and the fraction that is excreted is increased.