
Page 35 - Portfolio Analysis
P. 35
In figure 18 above, the total cash generated equals 240 units whilst the
cash used also equals 240 units. For simplicity’s sake the net resources of
the cash cow and dog segments are used to offset the shortfall in the star
and problem child segments. In particular, the star segment shows the 20
units being used to fund further research and development and distribution
channels. The remaining 80 units are used in the question mark quadrant.
STRATEGIC IMPLICATIONS
The product portfolio is helped not only because it facilitates the
development of strategies for specific products but also because it so
effectively potrrays the overall strategic position of the multi-product/mult-
division company. In the latter case the growth/share matrix is created by
dividing the company into its component businesses or segments, each of
which is capable of standing alone. These SBUs are then subjected to
similar analysis to that of products. From this a prognisis of how a
company’s portfolio might look in, say, five years time may be developed.
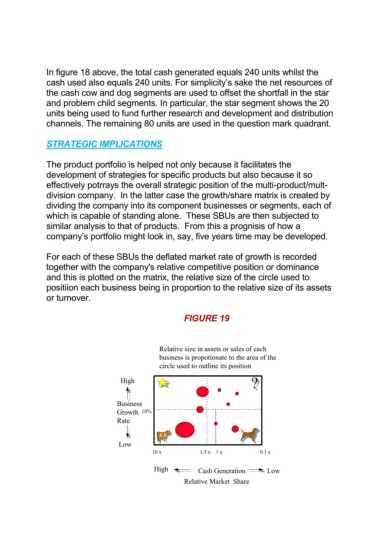
For each of these SBUs the deflated market rate of growth is recorded
together with the company's relative competitive position or dominance
and this is plotted on the matrix, the relative size of the circle used to
positiion each business being in proportion to the relative size of its assets
or turnover.
FIGURE 19
Relative size in assets or sales of each
business is propotionate to the area of the
circle used to outline its position
High ?
?
Business
Growth 10%
Rate
Low
10 x 1.5 x 1 x 0.1 x
High Cash Generation Low
Relative Market Share