
Page 107 - Guardian Broker Questionnaire Summary Complete Package 2 2 22_Neat
P. 107
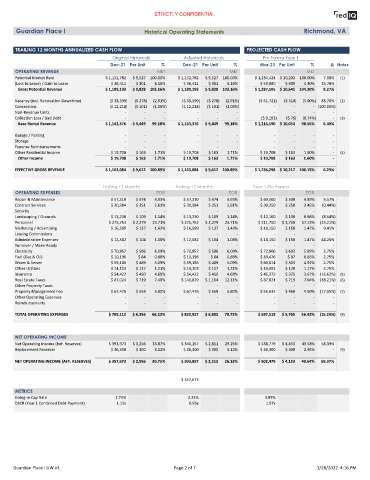
STRICTLY CONFIDENTIAL


         Guardian Place I                                          Historical Operating Statements                                           Richmond, VA


        TRAILING 12 MONTHS ANNUALIZED CASH FLOW                                                                    PROJECTED CASH FLOW

                                                     Original Historicals            Adjusted Historicals                 Pro Forma Year 1
                                                    Dec-21  Per Unit       %         Dec-21  Per Unit        %           Mar-23  Per Unit       %        Δ Notes
        OPERATING REVENUE                                                 Mkt                              Mkt                                Mkt
        Potential Market Rent                     $ 1,152,782  $ 9,527  100.00%    $ 1,152,782  $ 9,527  100.00%      $ 1,234,424  $ 10,202  100.00%  7.08%  (1)
        (Loss to Lease) / Gain to Lease             $ 36,411    $ 301   3.16%        $ 36,411    $ 301   3.16%           $ 53,080   $ 439    4.30%   45.78%
          Gross Potential Revenue                $ 1,189,193  $ 9,828 103.16%      $ 1,189,193  $ 9,828 103.16%       $ 1,287,505  $ 10,641 104.30%   8.27%

        Vacancy (incl. Renovation Downtime)        ($ 33,599)  ($ 278)  (2.91%)      ($ 33,599)  ($ 278)  (2.91%)       ($ 61,721)  ($ 510)  (5.00%)  83.70%  (2)
        Concessions                                ($ 12,218)  ($ 101)  (1.06%)      ($ 12,218)  ($ 101)  (1.06%)              -        -        - (100.00%)
        Non-Revenue Units                                 -        -        -               -        -        -                -        -        -        -
        Collection Loss / Bad Debt                        -        -        -               -        -        -          ($ 9,193)   ($ 76)  (0.74%)      -  (3)
          Base Rental Revenue                    $ 1,143,376  $ 9,449  99.18%      $ 1,143,376  $ 9,449  99.18%       $ 1,216,590  $ 10,054  98.56%   6.40%

        Garage / Parking                                  -        -        -               -        -        -                -        -        -        -
        Storage                                           -        -        -               -        -        -                -        -        -        -
        Expense Reimbursements                            -        -        -               -        -        -                -        -        -        -
        Other Residential Income                    $ 19,708    $ 163   1.71%        $ 19,708    $ 163   1.71%           $ 19,708   $ 163    1.60%        -  (4)
          Other Income                              $ 19,708   $ 163    1.71%        $ 19,708    $ 163   1.71%           $ 19,708   $ 163    1.60%        -

        EFFECTIVE GROSS REVENUE                  $ 1,163,084  $ 9,612 100.89%      $ 1,163,084  $ 9,612 100.89%       $ 1,236,298  $ 10,217 100.15%   6.29%


                                                Trailing 12 Months                Trailing 12 Months                 Year 1 Pro Forma
        OPERATING EXPENSES                                               EGR                               EGR                                EGR

        Repair & Maintenance                        $ 57,310    $ 474   4.93%        $ 57,310    $ 474   4.93%           $ 60,500   $ 500    4.89%    5.57%
        Contract Services                           $ 30,384    $ 251   2.61%        $ 30,384    $ 251   2.61%           $ 30,250   $ 250    2.45%   (0.44%)
        Security                                          -        -        -               -        -        -                -        -        -        -
        Landscaping / Grounds                       $ 13,230    $ 109   1.14%        $ 13,230    $ 109   1.14%           $ 12,100   $ 100    0.98%   (8.54%)
        Personnel                                  $ 275,753  $ 2,279  23.71%       $ 275,753  $ 2,279  23.71%          $ 211,750  $ 1,750  17.13%  (23.21%)
        Marketing / Advertising                     $ 16,589    $ 137   1.43%        $ 16,589    $ 137   1.43%           $ 18,150   $ 150    1.47%    9.41%
        Leasing Commissions                               -        -        -               -        -        -                -        -        -        -
        Administrative Expenses                     $ 12,582    $ 104   1.08%        $ 12,582    $ 104   1.08%           $ 18,150   $ 150    1.47%   44.26%
        Turnover / Make-Ready                             -        -        -               -        -        -                -        -        -        -
        Electricity                                 $ 70,857    $ 586   6.09%        $ 70,857    $ 586   6.09%           $ 72,806   $ 602    5.89%    2.75%
        Fuel (Gas & Oil)                            $ 10,196     $ 84   0.88%        $ 10,196     $ 84   0.88%           $ 10,476    $ 87    0.85%    2.75%
        Water & Sewer                               $ 59,186    $ 489   5.09%        $ 59,186    $ 489   5.09%           $ 60,814   $ 503    4.92%    2.75%
        Other Utilities                             $ 14,103    $ 117   1.21%        $ 14,103    $ 117   1.21%           $ 14,491   $ 120    1.17%    2.75%
        Insurance                                   $ 54,422    $ 450   4.68%        $ 54,422    $ 450   4.68%           $ 45,375   $ 375    3.67%  (16.62%)  (5)
        Real Estate Taxes                           $ 87,024    $ 719   7.48%       $ 140,839  $ 1,164  12.11%           $ 87,024   $ 719    7.04%  (38.21%)  (6)
        Other Property Taxes                              -        -        -               -        -        -                -        -        -        -
        Property Management Fee                     $ 67,476    $ 558   5.80%        $ 67,476    $ 558   5.80%           $ 55,633   $ 460    4.50%  (17.55%)  (7)
        Other Operating Expenses                          -        -        -               -        -        -                -        -        -        -
        Reimbursements                                    -        -        -               -        -        -                -        -        -        -


        TOTAL OPERATING EXPENSES                   $ 769,112  $ 6,356  66.13%       $ 822,927  $ 6,801  70.75%          $ 697,519  $ 5,765  56.42%  (15.24%)  (8)


        NET OPERATING INCOME
        Net Operating Income (bef. Reserves)       $ 393,973  $ 3,256  33.87%       $ 340,157  $ 2,811  29.25%          $ 538,779  $ 4,453  43.58%   58.39%
        Replacement Reserves                        $ 36,300    $ 300   3.12%        $ 36,300    $ 300   3.12%           $ 36,300   $ 300    2.94%        -  (9)

        NET OPERATING INCOME (AFT. RESERVES)       $ 357,673  $ 2,956  30.75%       $ 303,857  $ 2,511  26.13%          $ 502,479  $ 4,153  40.64%   65.37%


                                                                                    $ 357,673

        METRICS
        Going-In Cap Rate                             2.74%                            2.33%                               3.85%
        DSCR (Year 1 Combined Debt Payment)            1.12x                            0.95x                              1.57x


       Guardian Place I UW v3                                                    Page 2 of 7                                                       1/28/2022  4:16 PM