
Page 109 - Guardian Broker Questionnaire Summary Complete Package 2 2 22_Neat
P. 109
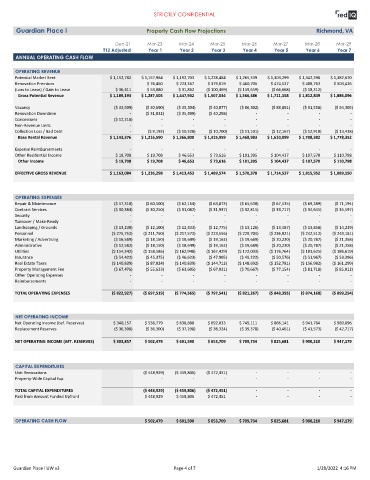
STRICTLY CONFIDENTIAL


        Guardian Place I                                           Property Cash Flow Projections                                             Richmond, VA


                                                     Dec-21        Mar-23        Mar-24         Mar-25        Mar-26        Mar-27        Mar-28        Mar-29
                                                T12 Adjusted       Year 1        Year 2         Year 3        Year 4        Year 5        Year 6        Year 7
        ANNUAL OPERATING CASH FLOW


        OPERATING REVENUE
        Potential Market Rent                     $ 1,152,782   $ 1,157,964   $ 1,192,703   $ 1,228,484    $ 1,265,339   $ 1,303,299   $ 1,342,398   $ 1,382,670
        Renovation Premium                                         $ 76,460     $ 223,367     $ 379,019     $ 460,706     $ 474,527     $ 488,763     $ 503,426
        (Loss to Lease) / Gain to Lease              $ 36,411      $ 53,080      $ 31,862    ($ 100,469)   ($ 159,659)    ($ 66,668)     ($ 18,312)           -
          Gross Potential Revenue                 $ 1,189,193   $ 1,287,505   $ 1,447,932   $ 1,507,034   $ 1,566,386    $ 1,711,158   $ 1,812,849   $ 1,886,096

        Vacancy                                     ($ 33,599)    ($ 30,690)    ($ 35,304)    ($ 40,077)    ($ 86,302)    ($ 88,891)     ($ 91,558)    ($ 94,305)
        Renovation Downtime                                -      ($ 31,032)    ($ 35,499)    ($ 40,298)           -             -              -             -
        Concessions                                 ($ 12,218)           -             -             -             -             -              -             -
        Non-Revenue Units                                  -             -             -             -             -             -              -             -
        Collection Loss / Bad Debt                         -       ($ 9,193)    ($ 10,328)    ($ 10,700)    ($ 11,101)    ($ 12,167)     ($ 12,910)    ($ 13,438)
          Base Rental Revenue                     $ 1,143,376   $ 1,216,590   $ 1,366,800   $ 1,415,959   $ 1,468,983    $ 1,610,099   $ 1,708,382   $ 1,778,352

        Expense Reimbursements                             -             -             -             -             -             -              -             -
        Other Residential Income                     $ 19,708      $ 19,708      $ 46,653      $ 73,616     $ 101,395     $ 104,437     $ 107,570     $ 110,798
          Other Income                               $ 19,708      $ 19,708      $ 46,653      $ 73,616     $ 101,395     $ 104,437     $ 107,570     $ 110,798


        EFFECTIVE GROSS REVENUE                   $ 1,163,084   $ 1,236,298   $ 1,413,453   $ 1,489,574   $ 1,570,378    $ 1,714,537   $ 1,815,952   $ 1,889,150


        OPERATING EXPENSES
        Repair & Maintenance                        ($ 57,310)    ($ 60,500)    ($ 62,164)    ($ 63,873)    ($ 65,630)    ($ 67,435)     ($ 69,289)    ($ 71,194)
        Contract Services                           ($ 30,384)    ($ 30,250)    ($ 31,082)    ($ 31,937)    ($ 32,815)    ($ 33,717)     ($ 34,645)    ($ 35,597)
        Security                                           -             -             -             -             -             -              -             -
        Turnover / Make-Ready                              -             -             -             -             -             -              -             -
        Landscaping / Grounds                       ($ 13,230)    ($ 12,100)    ($ 12,433)    ($ 12,775)    ($ 13,126)    ($ 13,487)     ($ 13,858)    ($ 14,239)
        Personnel                                  ($ 275,753)   ($ 211,750)   ($ 217,573)   ($ 223,556)   ($ 229,704)   ($ 236,021)    ($ 242,512)   ($ 249,181)
        Marketing / Advertising                     ($ 16,589)    ($ 18,150)    ($ 18,649)    ($ 19,162)    ($ 19,689)    ($ 20,230)     ($ 20,787)    ($ 21,358)
        Administrative                              ($ 12,582)    ($ 18,150)    ($ 18,649)    ($ 19,162)    ($ 19,689)    ($ 20,230)     ($ 20,787)    ($ 21,358)
        Utilities                                  ($ 154,342)   ($ 158,586)   ($ 162,948)   ($ 167,429)   ($ 172,033)   ($ 176,764)    ($ 181,625)   ($ 186,619)
        Insurance                                   ($ 54,422)    ($ 45,375)    ($ 46,623)    ($ 47,905)    ($ 49,222)    ($ 50,576)     ($ 51,967)    ($ 53,396)
        Real Estate Taxes                          ($ 140,839)    ($ 87,024)   ($ 140,839)   ($ 144,712)   ($ 148,692)   ($ 152,781)    ($ 156,982)   ($ 161,299)
        Property Management Fee                     ($ 67,476)    ($ 55,633)    ($ 63,605)    ($ 67,031)    ($ 70,667)    ($ 77,154)     ($ 81,718)    ($ 85,012)
        Other Operating Expenses                           -             -             -             -             -             -              -             -
        Reimbursements                                     -             -             -             -             -             -              -             -

        TOTAL OPERATING EXPENSES                   ($ 822,927)   ($ 697,519)   ($ 774,565)   ($ 797,541)   ($ 821,267)   ($ 848,395)    ($ 874,168)   ($ 899,254)


        NET OPERATING INCOME
        Net Operating Income (bef. Reserves)        $ 340,157     $ 538,779     $ 638,888     $ 692,033     $ 749,111     $ 866,141     $ 941,784     $ 989,896
        Replacement Reserves                        ($ 36,300)    ($ 36,300)    ($ 37,298)    ($ 38,324)    ($ 39,378)    ($ 40,461)     ($ 41,573)    ($ 42,717)


        NET OPERATING INCOME (AFT. RESERVES)        $ 303,857     $ 502,479     $ 601,590     $ 653,709     $ 709,734     $ 825,681     $ 900,210     $ 947,179


        CAPITAL EXPENDITURES
        Unit Renovations                                         ($ 448,929)   ($ 459,806)   ($ 472,451)           -             -              -             -
        Property-Wide Capital Exp.                                       -             -             -             -             -              -             -

        TOTAL CAPITAL EXPENDITURES                               ($ 448,929)   ($ 459,806)   ($ 472,451)           -             -              -             -
        Paid from Amount Funded Upfront                           $ 448,929     $ 459,806     $ 472,451            -             -              -             -


        OPERATING CASH FLOW                                       $ 502,479     $ 601,590     $ 653,709     $ 709,734     $ 825,681     $ 900,210     $ 947,179


       Guardian Place I UW v3                                                  Page 4 of 7                                                     1/28/2022  4:16 PM