
Page 114 - Guardian Broker Questionnaire Summary Complete Package 2 2 22_Neat
P. 114
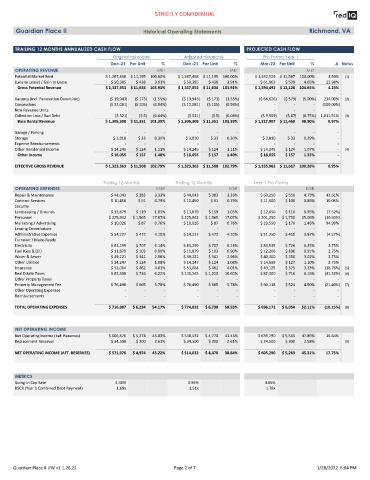
STRICTLY CONFIDENTIAL


         Guardian Place II                                          Historical Operating Statements                                              Richmond, VA


         TRAILING 12 MONTHS ANNUALIZED CASH FLOW                                                                    PROJECTED CASH FLOW

                                                      Original Historicals             Adjusted Historicals                 Pro Forma Year 1
                                                     Dec-21  Per Unit        %         Dec-21  Per Unit       %            Mar-23  Per Unit       %           Δ Notes
         OPERATING REVENUE                                                 Mkt                              Mkt                                 Mkt
        Potential Market Rent                     $ 1,287,468  $ 11,195  100.00%    $ 1,287,468  $ 11,195  100.00%      $ 1,332,529  $ 11,587  100.00%    3.50%   (1)
        (Loss to Lease) / Gain to Lease              $ 50,385   $ 438    3.91%         $ 50,385   $ 438    3.91%          $ 61,963    $ 539    4.65%     22.98%
          Gross Potential Revenue                 $ 1,337,853  $ 11,634  103.91%    $ 1,337,853  $ 11,634  103.91%      $ 1,394,492  $ 12,126  104.65%    4.23%

        Vacancy (incl. Renovation Downtime)         ($ 19,943)  ($ 173)  (1.55%)      ($ 19,943)  ($ 173)  (1.55%)        ($ 66,626)  ($ 579)  (5.00%)  234.09%   (2)
        Concessions                                 ($ 12,081)  ($ 105)  (0.94%)      ($ 12,081)  ($ 105)  (0.94%)               -        -        -   (100.00%)
        Non-Revenue Units                                  -        -        -               -        -        -                 -        -        -          -
        Collection Loss / Bad Debt                     ($ 521)    ($ 5)  (0.04%)        ($ 521)     ($ 5)  (0.04%)         ($ 9,959)  ($ 87)  (0.75%)  1,811.51%  (3)
          Base Rental Revenue                     $ 1,305,308  $ 11,351  101.39%    $ 1,305,308  $ 11,351  101.39%      $ 1,317,907  $ 11,460  98.90%     0.97%

        Garage / Parking                                   -        -        -               -        -        -                 -        -        -          -
        Storage                                       $ 3,810    $ 33    0.30%          $ 3,810    $ 33    0.30%           $ 3,810     $ 33    0.29%          -
        Expense Reimbursements                             -        -        -               -        -        -                 -        -        -          -
        Other Residential Income                     $ 14,245   $ 124    1.11%         $ 14,245   $ 124    1.11%          $ 14,245    $ 124    1.07%          -   (4)
          Other Income                               $ 18,055   $ 157    1.40%         $ 18,055   $ 157    1.40%          $ 18,055    $ 157    1.35%          -


        EFFECTIVE GROSS REVENUE                   $ 1,323,363  $ 11,508  102.79%    $ 1,323,363  $ 11,508  102.79%      $ 1,335,962  $ 11,617  100.26%    0.95%


                                                 Trailing 12 Months                Trailing 12 Months                  Year 1 Pro Forma
         OPERATING EXPENSES                                               EGR                               EGR                                 EGR
        Repair & Maintenance                         $ 44,043   $ 383    3.33%         $ 44,043   $ 383    3.33%          $ 63,250    $ 550    4.73%     43.61%
        Contract Services                            $ 10,450    $ 91    0.79%         $ 10,450    $ 91    0.79%          $ 11,500    $ 100    0.86%     10.05%
        Security                                           -        -        -               -        -        -                 -        -        -          -
        Landscaping / Grounds                        $ 13,679   $ 119    1.03%         $ 13,679   $ 119    1.03%          $ 12,650    $ 110    0.95%     (7.52%)
        Personnel                                   $ 225,942  $ 1,965  17.07%        $ 225,942  $ 1,965  17.07%         $ 201,250  $ 1,750   15.06%    (10.93%)
        Marketing / Advertising                      $ 10,026    $ 87    0.76%         $ 10,026    $ 87    0.76%          $ 19,550    $ 170    1.46%     94.99%
        Leasing Commissions                                -        -        -               -        -        -                 -        -        -          -
        Administrative Expenses                      $ 54,227   $ 472    4.10%         $ 54,227   $ 472    4.10%          $ 51,750    $ 450    3.87%     (4.57%)
        Turnover / Make-Ready                              -        -        -               -        -        -                 -        -        -          -
        Electricity                                  $ 81,299   $ 707    6.14%         $ 81,299   $ 707    6.14%          $ 83,535    $ 726    6.25%      2.75%
        Fuel (Gas & Oil)                             $ 11,879   $ 103    0.90%         $ 11,879   $ 103    0.90%          $ 12,206    $ 106    0.91%      2.75%
        Water & Sewer                                $ 39,221   $ 341    2.96%         $ 39,221   $ 341    2.96%          $ 40,300    $ 350    3.02%      2.75%
        Other Utilities                              $ 14,247   $ 124    1.08%         $ 14,247   $ 124    1.08%          $ 14,639    $ 127    1.10%      2.75%
        Insurance                                    $ 53,084   $ 462    4.01%         $ 53,084   $ 462    4.01%          $ 43,125    $ 375    3.23%    (18.76%)  (5)
        Real Estate Taxes                            $ 82,300   $ 716    6.22%        $ 140,245  $ 1,220  10.60%          $ 82,300    $ 716    6.16%    (41.32%)  (6)
        Other Property Taxes                               -        -        -               -        -        -                 -        -        -          -
        Property Management Fee                      $ 76,490   $ 665    5.78%         $ 76,490   $ 665    5.78%          $ 60,118    $ 523    4.50%    (21.40%)  (7)
        Other Operating Expenses                           -        -        -               -        -        -                 -        -        -          -
        Reimbursements                                     -        -        -               -        -        -                 -        -        -          -


        TOTAL OPERATING EXPENSES                    $ 716,887  $ 6,234  54.17%        $ 774,832  $ 6,738  58.55%         $ 696,172  $ 6,054   52.11%    (10.15%)  (8)


         NET OPERATING INCOME
        Net Operating Income (bef. Reserves)        $ 606,476  $ 5,274  45.83%        $ 548,532  $ 4,770  41.45%         $ 639,790  $ 5,563   47.89%     16.64%
        Replacement Reserves                         $ 34,500   $ 300    2.61%         $ 34,500   $ 300    2.61%          $ 34,500    $ 300    2.58%          -   (9)

        NET OPERATING INCOME (AFT. RESERVES)        $ 571,976  $ 4,974  43.22%        $ 514,032  $ 4,470  38.84%         $ 605,290  $ 5,263   45.31%     17.75%


         METRICS

        Going-In Cap Rate                              4.40%                             3.96%                              4.66%
        DSCR (Year 1 Combined Debt Payment)            1.68x                             1.51x                               1.78x


       Guardian Place II UW v1 1.26.22                                            Page 2 of 7                                                        1/28/2022  6:04 PM