
Page 116 - Guardian Broker Questionnaire Summary Complete Package 2 2 22_Neat
P. 116
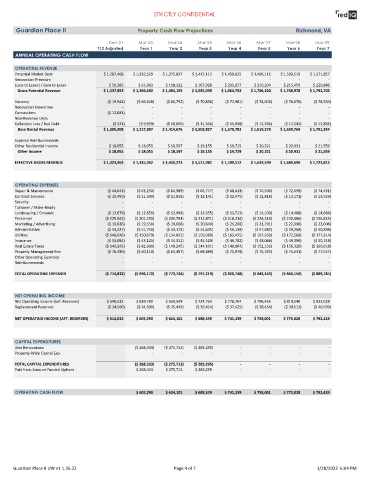
STRICTLY CONFIDENTIAL


         Guardian Place II                                        Property Cash Flow Projections                                             Richmond, VA


                                                     Dec-21        Mar-23        Mar-24        Mar-25        Mar-26        Mar-27        Mar-28        Mar-29
                                                T12 Adjusted       Year 1        Year 2        Year 3        Year 4        Year 5        Year 6        Year 7
         ANNUAL OPERATING CASH FLOW


         OPERATING REVENUE
         Potential Market Rent                    $ 1,287,468   $ 1,332,529   $ 1,375,837   $ 1,417,112   $ 1,459,625   $ 1,496,116   $ 1,533,519  $ 1,571,857
         Renovation Premium                                              -             -             -            -             -             -             -
         (Loss to Lease) / Gain to Lease             $ 50,385     $ 61,963     $ 118,322     $ 167,928     $ 205,077     $ 210,204     $ 215,459     $ 220,846
          Gross Potential Revenue                 $ 1,337,853   $ 1,394,492   $ 1,494,159   $ 1,585,039   $ 1,664,702   $ 1,706,320   $ 1,748,978  $ 1,792,702

         Vacancy                                    ($ 19,943)    ($ 66,626)    ($ 68,792)    ($ 70,856)    ($ 72,981)    ($ 74,806)   ($ 76,676)    ($ 78,593)
         Renovation Downtime                               -             -             -             -            -             -             -             -
         Concessions                                ($ 12,081)           -             -             -            -             -             -             -
         Non-Revenue Units                                 -             -             -             -            -             -             -             -
         Collection Loss / Bad Debt                   ($ 521)      ($ 9,959)    ($ 10,690)    ($ 11,356)    ($ 11,938)    ($ 12,236)   ($ 12,542)    ($ 12,856)
          Base Rental Revenue                     $ 1,305,308   $ 1,317,907   $ 1,414,676   $ 1,502,827   $ 1,579,783   $ 1,619,278   $ 1,659,760  $ 1,701,254

         Expense Reimbursements                            -             -             -             -            -             -             -             -
         Other Residential Income                    $ 18,055     $ 18,055      $ 18,597      $ 19,155      $ 19,729      $ 20,321      $ 20,931      $ 21,559
          Other Income                              $ 18,055      $ 18,055      $ 18,597      $ 19,155      $ 19,729      $ 20,321      $ 20,931      $ 21,559

         EFFECTIVE GROSS REVENUE                  $ 1,323,363   $ 1,335,962   $ 1,433,273   $ 1,521,982   $ 1,599,512   $ 1,639,599   $ 1,680,690  $ 1,722,812


         OPERATING EXPENSES
         Repair & Maintenance                       ($ 44,043)    ($ 63,250)    ($ 64,989)    ($ 66,777)    ($ 68,613)    ($ 70,500)   ($ 72,439)    ($ 74,431)
         Contract Services                          ($ 10,450)    ($ 11,500)    ($ 11,816)    ($ 12,141)    ($ 12,475)    ($ 12,818)   ($ 13,171)    ($ 13,533)
         Security                                          -             -             -             -            -             -             -             -
         Turnover / Make-Ready                             -             -             -             -            -             -             -             -
         Landscaping / Grounds                      ($ 13,679)    ($ 12,650)    ($ 12,998)    ($ 13,355)    ($ 13,723)    ($ 14,100)   ($ 14,488)    ($ 14,886)
         Personnel                                 ($ 225,942)   ($ 201,250)   ($ 206,784)   ($ 212,471)   ($ 218,314)   ($ 224,318)  ($ 230,486)   ($ 236,825)
         Marketing / Advertising                    ($ 10,026)    ($ 19,550)    ($ 20,088)    ($ 20,640)    ($ 21,208)    ($ 21,791)   ($ 22,390)    ($ 23,006)
         Administrative                             ($ 54,227)    ($ 51,750)    ($ 53,173)    ($ 54,635)    ($ 56,138)    ($ 57,682)   ($ 59,268)    ($ 60,898)
         Utilities                                 ($ 146,646)   ($ 150,679)   ($ 154,822)   ($ 159,080)   ($ 163,455)   ($ 167,950)  ($ 172,568)   ($ 177,314)
         Insurance                                  ($ 53,084)    ($ 43,125)    ($ 44,311)    ($ 45,529)    ($ 46,782)    ($ 48,068)   ($ 49,390)    ($ 50,748)
         Real Estate Taxes                         ($ 140,245)    ($ 82,300)   ($ 140,245)   ($ 144,101)   ($ 148,064)   ($ 152,136)  ($ 156,320)   ($ 160,618)
         Property Management Fee                    ($ 76,490)    ($ 60,118)    ($ 64,497)    ($ 68,489)    ($ 71,978)    ($ 73,782)   ($ 75,631)    ($ 77,527)
         Other Operating Expenses                          -             -             -             -            -             -             -             -
         Reimbursements                                    -             -             -             -            -             -             -             -

         TOTAL OPERATING EXPENSES                  ($ 774,832)   ($ 696,172)   ($ 773,724)   ($ 797,219)   ($ 820,748)  ($ 843,143)   ($ 866,150)   ($ 889,785)


         NET OPERATING INCOME
         Net Operating Income (bef. Reserves)       $ 548,532    $ 639,790     $ 659,549     $ 724,763     $ 778,764     $ 796,455     $ 814,540     $ 833,028
         Replacement Reserves                       ($ 34,500)    ($ 34,500)    ($ 35,449)    ($ 36,424)    ($ 37,425)    ($ 38,454)   ($ 39,512)    ($ 40,599)

         NET OPERATING INCOME (AFT. RESERVES)      $ 514,032     $ 605,290     $ 624,101     $ 688,339     $ 741,339     $ 758,001     $ 775,028     $ 792,429


         CAPITAL EXPENDITURES
         Unit Renovations                                        ($ 268,333)   ($ 275,713)   ($ 283,295)          -             -             -             -
         Property-Wide Capital Exp.                                      -             -             -            -             -             -             -

         TOTAL CAPITAL EXPENDITURES                              ($ 268,333)   ($ 275,713)   ($ 283,295)          -             -             -             -
         Paid from Amount Funded Upfront                         $ 268,333     $ 275,713     $ 283,295            -             -             -             -


         OPERATING CASH FLOW                                     $ 605,290     $ 624,101     $ 688,339     $ 741,339     $ 758,001     $ 775,028     $ 792,429


       Guardian Place II UW v1 1.26.22                                             Page 4 of 7                                                         1/28/2022  6:04 PM