
Page 41 - DUT Annual Report 2023
P. 41
The Faculty of Accounting and Informatics and Faculty of Health Sciences experienced a slight increase of 0.36% and 0.69% in its FTEN intake respectively, while the Faculty of Engineering and the Built Environment and the Faculty of Applied Sciences achieved a 32.33% and 9.02% increase, respectively, in their FTEN enrolments. Of concern is that the Faculty of Management Sciences and the Faculty of Arts and Design showed declines of 5.23%, and 5.05%, respectively, which could be attributed to students not meeting the entrance requirements. Also, there was a significant increase in the number of PG students by nearly 2.21% in 2023. Figure 3 illustrates the five-year trend in total headcount enrolments.
36,000
35,442
Figure 3. Total headcount enrolments, 2019–2023
35,000
34,000
33,000
32,000
31,000
33,933
33,196
32,089
32,561
Race
2019 2020 2021 Year
2022 2023
s
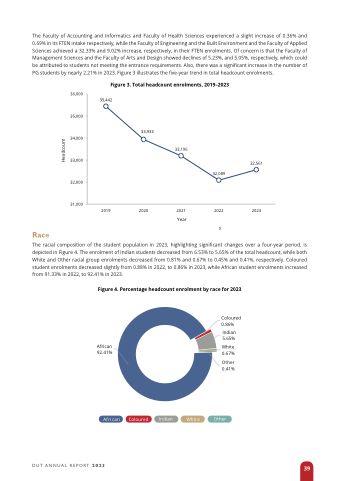
The racial composition of the student population in 2023, highlighting significant changes over a four-year period, is depicted in Figure 4. The enrolment of Indian students decreased from 6.53% to 5.65% of the total headcount, while both White and Other racial group enrolments decreased from 0.81% and 0.67% to 0.45% and 0.41%, respectively. Coloured student enrolments decreased slightly from 0.88% in 2022, to 0.86% in 2023, while African student enrolments increased from 91.33% in 2022, to 92.41% in 2023.
Figure 4. Percentage headcount enrolment by race for 2023
African 92.41%
Coloured 0.86%
Indian 5.65%
White 0.67%
Other 0.41%
African Coloured Indian White Other
African Coloured Indian White Other
DUT ANNUAL REPORT 2023
39
Headcount
