
Page 53 - DUT Annual Report 2023
P. 53
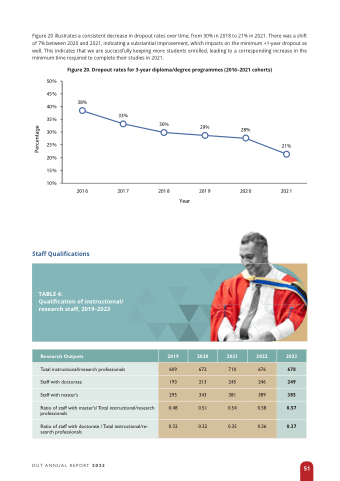
   Figure 20 illustrates a consistent decrease in dropout rates over time, from 30% in 2018 to 21% in 2021. There was a shift of 7% between 2020 and 2021, indicating a substantial improvement, which impacts on the minimum +1-year dropout as well. This indicates that we are successfully keeping more students enrolled, leading to a corresponding increase in the minimum time required to complete their studies in 2021.
Figure 20. Dropout rates for 3-year diploma/degree programmes (2016–2021 cohorts)
                                                                                             Staff Qualifications
                   TABLE 4:
Qualification of instructional/ research staff, 2019–2023
                   Research Outputs
    2019
   2020
   2021
  2022
   2023
 Total instructional/research professionals
609
672
710
676
678
 Staff with doctorate
  193
  213
  245
  246
  249
 Staff with master’s
 295
 343
 381
 389
 385
 Ratio of staff with master’s/ Total instructional/research professionals
0.48
0.51
0.54
0.58
0.57
 Ratio of staff with doctorate / Total instructional/re- search professionals
  0.32
  0.32
  0.35
  0.36
  0.37
      DUT ANNUAL REPORT 2023
51
