
Page 51 - DUT Annual Report 2023
P. 51
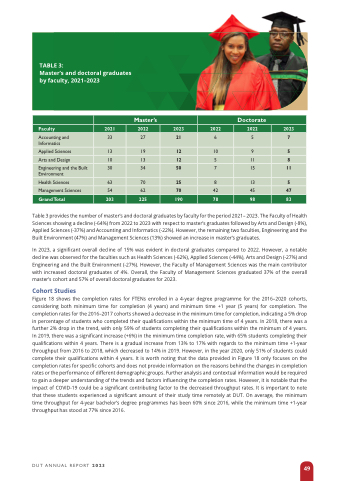
                         TABLE 3:
Master’s and doctoral graduates by faculty, 2021–2023
                       Master’s
  Doctorate
 Faculty
  2021
   2022
  2023
  2022
  2022
  2023
  Accounting and Informatics
  33
 27
21
  6
5
  7
 Applied Sciences
 13
  19
 12
 10
 9
 5
 Arts and Design
  10
   13
  12
  5
  11
  8
  Engineering and the Built Environment
  30
 34
50
  7
15
  11
 Health Sciences
  63
   70
  25
  8
  13
  5
  Management Sciences
   54
  62
 70
   42
 45
   47
  Grand Total
   203
  225
 190
   78
 98
   83
   Table 3 provides the number of master’s and doctoral graduates by faculty for the period 2021– 2023. The Faculty of Health Sciences showing a decline (-64%) from 2022 to 2023 with respect to master’s graduates followed by Arts and Design (-8%), Applied Sciences (-37%) and Accounting and Informatics (-22%). However, the remaining two faculties, Engineering and the Built Environment (47%) and Management Sciences (13%) showed an increase in master’s graduates.
In 2023, a significant overall decline of 15% was evident in doctoral graduates compared to 2022. However, a notable decline was observed for the faculties such as Health Sciences (-62%), Applied Sciences (-44%), Arts and Design (-27%) and Engineering and the Built Environment (-27%). However, the Faculty of Management Sciences was the main contributor with increased doctoral graduates of 4%. Overall, the Faculty of Management Sciences graduated 37% of the overall master’s cohort and 57% of overall doctoral graduates for 2023.
Cohort Studies
Figure 18 shows the completion rates for FTENs enrolled in a 4-year degree programme for the 2016–2020 cohorts, considering both minimum time for completion (4 years) and minimum time +1 year (5 years) for completion. The completion rates for the 2016–2017 cohorts showed a decrease in the minimum time for completion, indicating a 5% drop in percentage of students who completed their qualifications within the minimum time of 4 years. In 2018, there was a further 2% drop in the trend, with only 59% of students completing their qualifications within the minimum of 4 years. In 2019, there was a significant increase (+6%) in the minimum time completion rate, with 65% students completing their qualifications within 4 years. There is a gradual increase from 13% to 17% with regards to the minimum time +1-year throughput from 2016 to 2018, which decreased to 14% in 2019. However, in the year 2020, only 51% of students could complete their qualifications within 4 years. It is worth noting that the data provided in Figure 18 only focuses on the completion rates for specific cohorts and does not provide information on the reasons behind the changes in completion rates or the performance of different demographic groups. Further analysis and contextual information would be required to gain a deeper understanding of the trends and factors influencing the completion rates. However, it is notable that the impact of COVID-19 could be a significant contributing factor to the decreased throughput rates. It is important to note that these students experienced a significant amount of their study time remotely at DUT. On average, the minimum time throughput for 4-year bachelor’s degree programmes has been 60% since 2016, while the minimum time +1-year throughput has stood at 77% since 2016.
 DUT ANNUAL REPORT 2023
49
