


Page 132 - MAT KS3 Y8 Cambridge CheckPoint
P. 132
13.1 Drawing graphs of equations


               13.1 Drawing graphs of equations


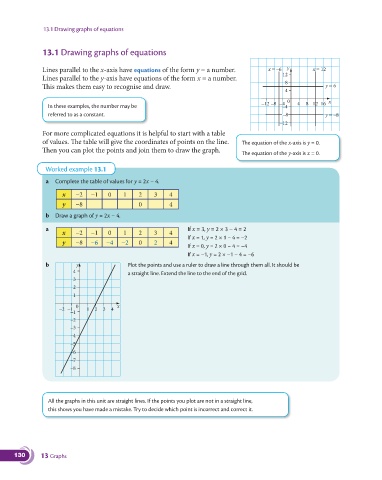
               Lines parallel to the x-axis have equations of the form y = a number.      x = –6  y      x = 12
                                                                                               12
               Lines parallel to the y-axis have equations of the form x = a number.
                                                                                                8
               This makes them easy to recognise and draw.                                                    y = 6
                                                                                                4
                                                                                                 0             x
                                                                                        –12 –8 –4   4  8 12  16
                 In these examples, the number may be                                          –4
                 referred to as a constant.                                                    –8             y = –8
                                                                                              –12
               For more complicated equations it is helpful to start with a table
               of values. The table will give the coordinates of points on the line.    The equation of the x-axis is y = 0.
               Then you can plot the points and join them to draw the graph.
                                                                                  The equation of the y-axis is x = 0.

                Worked example 13.1
                a  Complete the table of values for y = 2x − 4.

                      x   −2   −1    0    1    2    3     4
                      y   −8                   0          4
                b  Draw a graph of y = 2x − 4.

                a                                               If x = 3, y = 2 × 3 − 4 = 2
                      x   −2   −1    0    1    2    3     4
                                                                If x = 1, y = 2 × 1 − 4 = −2
                      y   −8   −6   −4    −2   0    2     4
                                                                If x = 0, y = 2 × 0 − 4 = −4
                                                                If x = −1, y = 2 × −1 − 4 = −6

                b         y                Plot the points and use a ruler to draw a line through them all. It should be
                         4                  a straight line. Extend the line to the end of the grid.
                         3
                         2
                         1
                          0             x
                     –2 –1    1  2  3  4
                         –1
                         –2
                         –3
                         –4
                         –5
                         –6
                         –7
                         –8


                 All the graphs in this unit are straight lines. If the points you plot are not in a straight line,
                 this shows you have made a mistake. Try to decide which point is incorrect and correct it.


      130      13 Graphs

