


Page 133 - MAT KS3 Y8 Cambridge CheckPoint
P. 133
13.1 Drawing graphs of equations


               ✦     Exercise 13.1


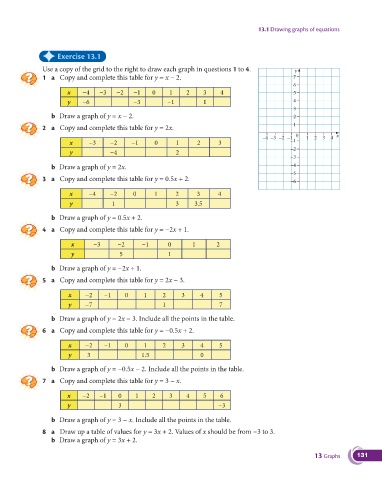
                   Use a copy of the grid to the right to draw each graph in questions 1 to 4.     y
               1 a  Copy and complete this table for y = x − 2.                                    7
                                                                                                   6
                        x    −4   −3    −2    −1    0     1    2     3     4                       5
                        y    −6               −3         −1          1                             4
                                                                                                   3
                  b  Draw a graph of y = x − 2.                                                    2
                                                                                                   1
               2 a  Copy and complete this table for y = 2x.
                                                                                                    0            x
                                                                                         –4  –3  –2 –1  1  2  3  4
                        x      −3     −2     −1      0      1      2      3                       –1
                        y             −4                    2                                     –2
                                                                                                  –3
                  b  Draw a graph of y = 2x.                                                      –4
                                                                                                  –5
               3 a  Copy and complete this table for y = 0.5x + 2.
                                                                                                  –6
                        x      −4     −2     0       1      2      3      4
                        y             1                     3     3.5

                  b  Draw a graph of y = 0.5x + 2.
               4 a  Copy and complete this table for y = −2x + 1.

                         x      −3      −2      −1       0       1       2
                         y               5               1

                  b  Draw a graph of y = −2x + 1.

               5 a  Copy and complete this table for y = 2x − 3.

                        x     −2    −1     0     1     2      3     4     5
                        y     −7                       1                  7

                  b  Draw a graph of y = 2x − 3. Include all the points in the table.
               6 a  Copy and complete this table for y = −0.5x + 2.

                        x     −2    −1     0     1     2      3     4     5
                        y     3                 1.5                 0

                  b  Draw a graph of y = −0.5x − 2. Include all the points in the table.

               7 a  Copy and complete this table for y = 3 − x.

                        x    −2   −1     0    1     2     3    4     5     6
                        y                3                                −3

                  b  Draw a graph of y = 3 − x. Include all the points in the table.
               8 a  Draw up a table of values for y = 3x + 2. Values of x should be from −3 to 3.
                  b  Draw a graph of y = 3x + 2.

                                                                                                          13 Graphs     131

