


Page 138 - MAT KS3 Y8 Cambridge CheckPoint
P. 138
13.4 Graphs in real-life contexts


               13.4 Graphs in real-life contexts


               Graphs give information in a visual form. Therefore, they    Real-life graphs usually only have positive
               are often used in real-life contexts because they can be     axes. They may not start at zero.
               easier to interpret than a table or chart.

               The numbers on the axes can represent almost anything. You will usually see a different variable on
               each axis. Often, one of the axes will show time.

               Read any labels on the axes and look at the scale carefully to see what the intervals on each axis
               stand for.


                 Worked example 13.4

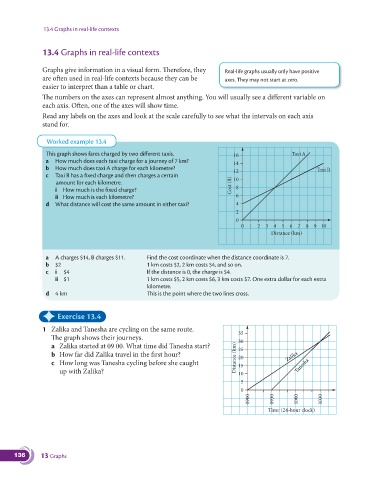
                  This graph shows fares charged by two different taxis.        16                 Taxi A
                a  How much does each taxi charge for a journey of 7 km?
                                                                               14
                b  How much does taxi A charge for each kilometre?                                         Taxi B
                                                                               12
                c  Taxi B has a fixed charge and then charges a certain         10
                    amount for each kilometre.                                Cost ($)
                   i  How much is the fixed charge?                              8
                   ii  How much is each kilometre?                              6
                d  What distance will cost the same amount in either taxi?      4
                                                                                2
                                                                                0
                                                                                  0  1  2  3  4  5  6  7  8  9 10
                                                                                            Distance (km)


                a  A charges $14, B charges $11.   Find the cost coordinate when the distance coordinate is 7.
                b  $2                             1 km costs $2, 2 km costs $4, and so on.
                c  i  $4                          If the distance is 0, the charge is $4.
                   ii  $1                           1 km costs $5, 2 km costs $6, 3 km costs $7. One extra dollar for each extra
                                                  kilometre.
                d  4 km                           This is the point where the two lines cross.

               ✦     Exercise 13.4


               1  Zalika and Tanesha are cycling on the same route.
                                                                                 35
                  The graph shows their journeys.                                30
                  a  Zalika started at 09 00. What time did Tanesha start?       25
                  b  How far did Zalika travel in the first hour?               Distance (km)  20  Zalika
                  c   How long was Tanesha cycling before she caught             15                 Tanesha
                     up with Zalika?                                             10
                                                                                 5
                                                                                 0
                                                                                    0900    0930    1000    1030

                                                                                           Time (24-hour clock)


      136      13 Graphs

