


Page 141 - MAT KS3 Y8 Cambridge CheckPoint
P. 141
End-of-unit review


                 End-of-unit review                                                              y
                                                                                                4

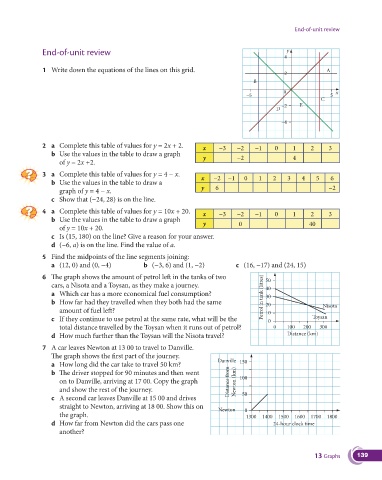
               1  Write down the equations of the lines on this grid.                                         A
                                                                                                2
                                                                                      B

                                                                                                0                x
                                                                                   –5                          5
                                                                                                            C
                                                                                               –2    E
                                                                                             D
                                                                                               –4


               2 a  Complete this table of values for y = 2x + 2.    x    −3    −2    −1     0     1     2     3
                  b   Use the values in the table to draw a graph    y          −2                 4
                     of y = 2x +2.

               3  a   Complete this table of values for y = 4 − x.  x   −2   −1    0   1    2    3    4    5   6
                  b   Use the values in the table to draw a
                     graph of y = 4 − x.                            y    6                                     −2
                  c  Show that (−24, 28) is on the line.
               4 a  Complete this table of values for y = 10x + 20.  x    −3    −2    −1     0     1     2     3
                  b   Use the values in the table to draw a graph    y           0                      40
                     of y = 10x + 20.
                  c   Is (15, 180) on the line? Give a reason for your answer.
                  d  (−6, a) is on the line. Find the value of a.

               5  Find the midpoints of the line segments joining:
                  a  (12, 0) and (0, −4)         b (−3, 6) and (1, −2)          c (16, −17) and (24, 15)

               6   The graph shows the amount of petrol left in the tanks of two          50
                  cars, a Nisota and a Toysan, as they make a journey.                    40
                  a  Which car has a more economical fuel consumption?                   Petrol in tank (litres)  30
                  b   How far had they travelled when they both had the same              20                 Nisota
                     amount of fuel left?                                                 10
                  c   If they continue to use petrol at the same rate, what will be the    0             Toysan
                     total distance travelled by the Toysan when it runs out of petrol?     0    100  200   300
                  d  How much further than the Toysan will the Nisota travel?                    Distance (km)

               7  A car leaves Newton at 13 00 to travel to Danville.
                  The graph shows the first part of the journey.
                                                                          Danville 150
                  a  How long did the car take to travel 50 km?
                  b   The driver stopped for 90 minutes and then went
                     on to Danville, arriving at 17 00. Copy the graph       Distance from  Newton (km)  100
                     and show the rest of the journey.
                  c   A second car leaves Danville at 15 00 and drives            50
                     straight to Newton, arriving at 18 00. Show this on
                                                                          Newton   0
                     the graph.                                                    1300  1400  1500  1600  1700  1800
                  d   How far from Newton did the cars pass one                             24-hour clock time
                     another?


                                                                                                          13 Graphs     139

