


Page 139 - MAT KS3 Y8 Cambridge CheckPoint
P. 139
13.4 Graphs in real-life contexts


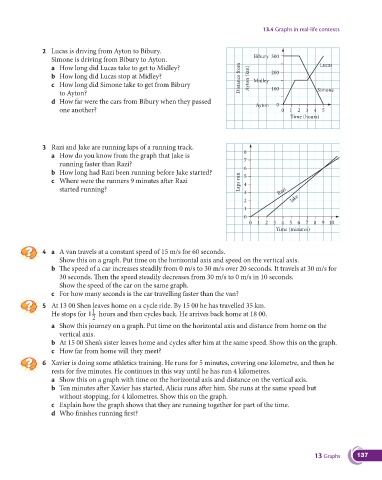
               2  Lucas is driving from Ayton to Bibury.
                                                                                      Bibury  300
                  Simone is driving from Bibury to Ayton.
                  a  How long did Lucas take to get to Midley?                                              Lucas
                  b  How long did Lucas stop at Midley?                          Distance from  Ayton (km)  200
                  c   How long did Simone take to get from Bibury                     Midley
                     to Ayton?                                                              100            Simone
                  d   How far were the cars from Bibury when they passed
                                                                                      Ayton  0
                     one another?                                                              0  1  2  3  4  5
                                                                                                  Time (hours)


               3  Razi and Jake are running laps of a running track.
                                                                                  8
                  a   How do you know from the graph that Jake is
                                                                                  7
                     running faster than Razi?
                                                                                  6
                  b  How long had Razi been running before Jake started?          5
                  c   Where were the runners 9 minutes after Razi                Laps run  4
                     started running?
                                                                                  3           Razi
                                                                                  2               Jake
                                                                                  1
                                                                                  0
                                                                                    0  1  2  3  4  5  6  7  8  9 10
                                                                                             Time (minutes)


               4 a  A van travels at a constant speed of 15 m/s for 60 seconds.
                    Show this on a graph. Put time on the horizontal axis and speed on the vertical axis.
                  b   The speed of a car increases steadily from 0 m/s to 30 m/s over 20 seconds. It travels at 30 m/s for
                     30 seconds. Then the speed steadily decreases from 30 m/s to 0 m/s in 10 seconds.
                    Show the speed of the car on the same graph.
                  c  For how many seconds is the car travelling faster than the van?

               5  At 13 00 Shen leaves home on a cycle ride. By 15 00 he has travelled 35 km.
                                1
                  He stops for 1  hours and then cycles back. He arrives back home at 18 00.
                                2
                  a   Show this journey on a graph. Put time on the horizontal axis and distance from home on the
                     vertical axis.
                  b  At 15 00 Shen’s sister leaves home and cycles after him at the same speed. Show this on the graph.
                  c  How far from home will they meet?

               6   Xavier is doing some athletics training. He runs for 5 minutes, covering one kilometre, and then he
                  rests for five minutes. He continues in this way until he has run 4 kilometres.
                  a  Show this on a graph with time on the horizontal axis and distance on the vertical axis.
                  b   Ten minutes after Xavier has started, Alicia runs after him. She runs at the same speed but
                     without stopping, for 4 kilometres. Show this on the graph.
                  c  Explain how the graph shows that they are running together for part of the time.
                  d  Who finishes running first?


                                                                                                          13 Graphs     137

