


Page 131 - MAT KS3 Y8 Cambridge CheckPoint
P. 131
13 Graphs


               In the 17th century the Frenchman René Descartes showed how to        Key words
               plot points on a grid and use this to draw lines and curves.
                                                                                    Make sure you learn and
               In his honour we still call this method ‘Cartesian coordinates’.
                                                                                    understand these key words:
               You have used positive and negative numbers as coordinates to        equation
               show points on a Cartesian grid. You know that equations involving    line segment
               x and y can correspond to lines and curves on such a coordinate      midpoint
               grid.

                                y
                 (–2, 3)        3               y = x
                                                     (4, 2)
                                2


                                1


                 –3   –2    –1    0    1    2     3    4  x

                               –1
                                                    y = –2
                               –2

                               –3       (1, –3)


               Graphs also have many practical applications in real life. A graph
               can be easier to read and understand than a table or chart.
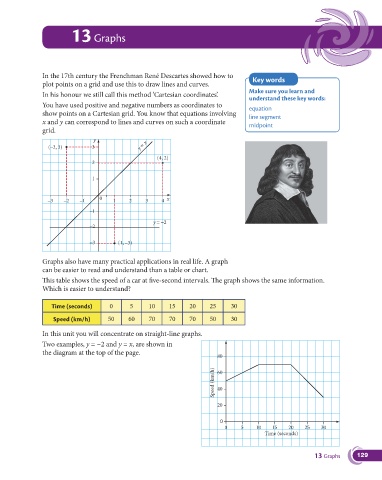
               This table shows the speed of a car at five-second intervals. The graph shows the same information.
               Which is easier to understand?

                  Time (seconds)      0     5      10    15     20     25     30

                   Speed (km/h)      50     60     70    70     70     50     30

               In this unit you will concentrate on straight-line graphs.
               Two examples, y = −2 and y = x, are shown in
               the diagram at the top of the page.
                                                                          80
                                                                        Speed (km/h)  60


                                                                          40


                                                                          20

                                                                           0
                                                                            0    5    10    15   20    25   30
                                                                                         Time (seconds)


                                                                                                          13 Graphs     129

