
Page 43 - NEW FOREX FULL COURSE
P. 43
FOREX TRADING COURSE FOR BEGINNERS
LOW AND HIGH VS CLOSE
A trend line can be drawn when two points are available. The more times a trend line is touched,
the more technically significant this support or resistance line becomes.
While some chartists draw trend lines through lows and highs, others may prefer drawing lines
through closes in hopes of detecting a change in trend more quickly.
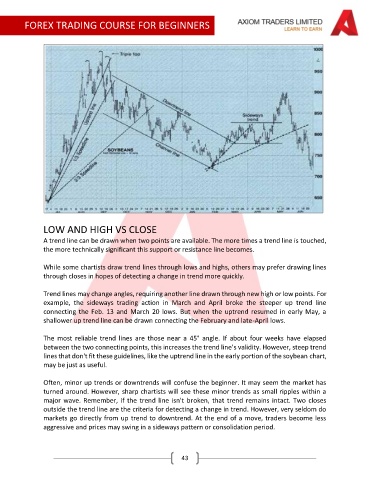
Trend lines may change angles, requiring another line drawn through new high or low points. For
example, the sideways trading action in March and April broke the steeper up trend line
connecting the Feb. 13 and March 20 lows. But when the uptrend resumed in early May, a
shallower up trend line can be drawn connecting the February and late-April lows.
The most reliable trend lines are those near a 45° angle. If about four weeks have elapsed
between the two connecting points, this increases the trend line’s validity. However, steep trend
lines that don't fit these guidelines, like the uptrend line in the early portion of the soybean chart,
may be just as useful.
Often, minor up trends or downtrends will confuse the beginner. It may seem the market has
turned around. However, sharp chartists will see these minor trends as small ripples within a
major wave. Remember, if the trend line isn't broken, that trend remains intact. Two closes
outside the trend line are the criteria for detecting a change in trend. However, very seldom do
markets go directly from up trend to downtrend. At the end of a move, traders become less
aggressive and prices may swing in a sideways pattern or consolidation period.
43